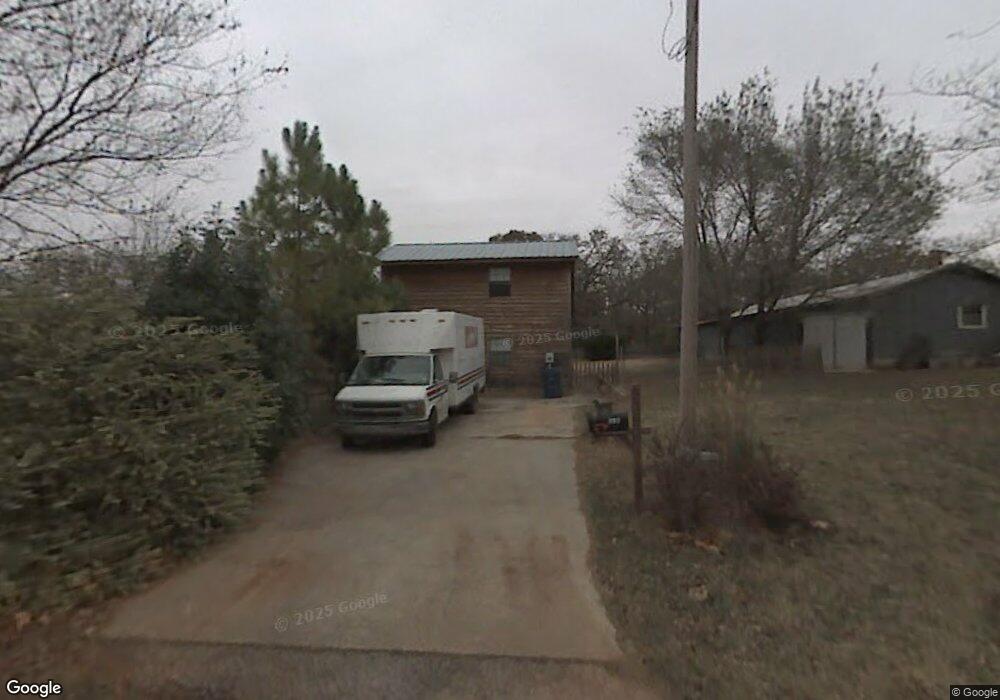
515 NW 6th St Blanchard, OK 73010
Estimated Value: $187,000 - $202,248
2
Beds
2
Baths
1,222
Sq Ft
$160/Sq Ft
Est. Value
About This Home
This home is located at 515 NW 6th St, Blanchard, OK 73010 and is currently estimated at $195,562, approximately $160 per square foot. 515 NW 6th St is a home located in McClain County with nearby schools including Blanchard Elementary School, Blanchard Intermediate School, and Blanchard Middle School.
Ownership History
Date
Name
Owned For
Owner Type
Purchase Details
Closed on
Aug 17, 2022
Sold by
Curry Melva J
Bought by
Dubbs Jessica R
Current Estimated Value
Home Financials for this Owner
Home Financials are based on the most recent Mortgage that was taken out on this home.
Original Mortgage
$152,192
Outstanding Balance
$145,053
Interest Rate
5.3%
Mortgage Type
FHA
Estimated Equity
$50,509
Purchase Details
Closed on
Jan 5, 2011
Sold by
Towery Justine
Bought by
Curry Melva J
Home Financials for this Owner
Home Financials are based on the most recent Mortgage that was taken out on this home.
Original Mortgage
$80,901
Interest Rate
4.87%
Mortgage Type
FHA
Purchase Details
Closed on
Jan 3, 2003
Sold by
Bridges Jeffrey and Bridges Rhonda
Bought by
Towery Danny R
Purchase Details
Closed on
Jun 18, 1996
Sold by
Pickard Bro Homes
Bought by
Bridges Jeffrey and Bridges Rhonda
Create a Home Valuation Report for This Property
The Home Valuation Report is an in-depth analysis detailing your home's value as well as a comparison with similar homes in the area
Home Values in the Area
Average Home Value in this Area
Purchase History
| Date | Buyer | Sale Price | Title Company |
|---|---|---|---|
| Dubbs Jessica R | $155,000 | First American Title | |
| Curry Melva J | $89,000 | Gaco | |
| Towery Danny R | $82,000 | -- | |
| Bridges Jeffrey | $63,500 | -- |
Source: Public Records
Mortgage History
| Date | Status | Borrower | Loan Amount |
|---|---|---|---|
| Open | Dubbs Jessica R | $152,192 | |
| Previous Owner | Curry Melva J | $80,901 | |
| Closed | Dubbs Jessica R | $5,326 |
Source: Public Records
Tax History Compared to Growth
Tax History
| Year | Tax Paid | Tax Assessment Tax Assessment Total Assessment is a certain percentage of the fair market value that is determined by local assessors to be the total taxable value of land and additions on the property. | Land | Improvement |
|---|---|---|---|---|
| 2025 | $1,911 | $17,550 | $5,869 | $11,681 |
| 2024 | $1,911 | $16,715 | $4,840 | $11,875 |
| 2023 | $1,911 | $17,050 | $6,359 | $10,691 |
| 2022 | $1,190 | $10,389 | $1,843 | $8,546 |
| 2021 | $1,134 | $9,894 | $1,540 | $8,354 |
| 2020 | $1,288 | $9,894 | $1,540 | $8,354 |
| 2019 | $1,379 | $10,395 | $1,540 | $8,855 |
| 2018 | $1,213 | $10,049 | $1,540 | $8,509 |
| 2017 | $1,261 | $9,570 | $1,540 | $8,030 |
| 2016 | $1,150 | $9,338 | $1,540 | $7,798 |
| 2015 | $1,361 | $10,803 | $1,043 | $9,760 |
| 2014 | $1,328 | $10,288 | $1,047 | $9,241 |
Source: Public Records
Map
Nearby Homes
- 711 N Van Buren Ave
- 721 N Harrison Ave
- 1133 Wild Rye Ct
- 1378 Heartwood Dr
- 1692 Appaloosa Dr
- 416 S Harrison Ave
- 609 S County Line Ave
- 1403 Pecan Dr
- 1850 Olivia Ct
- 300 Bailey St
- 1621 Silver Oak Dr
- 945 Fox Run Ln
- 254 Megan Ct
- 255 Megan Ct
- 694 Isabella Dr
- 437 Isabella Dr
- 756 SW 11th St
- 813 Summer Oaks Dr
- 26964 Bridlewood Rd
- 2435 Heather Rd
- 505 NW 6th St
- 502 NW 6th St
- 504 NW 6th St
- 422 NW 6th St
- 601 N Jefferson Ave
- 601 N Jefferson Ave
- 601 N Jefferson Ave
- 601 N Jefferson Ave
- 601 N Jefferson Ave
- 601 N Jefferson Ave
- 601 N Jefferson Ave
- 601 N Jefferson Ave
- 400 NW 6th St
- 422 N Washington Ave
- 505 N Jefferson Ave
- 517 N Jefferson Ave
- 503 N Jefferson Ave
- 28724 N Adams Ave
- 412 N Washington Ave
- 314 NW 7th St