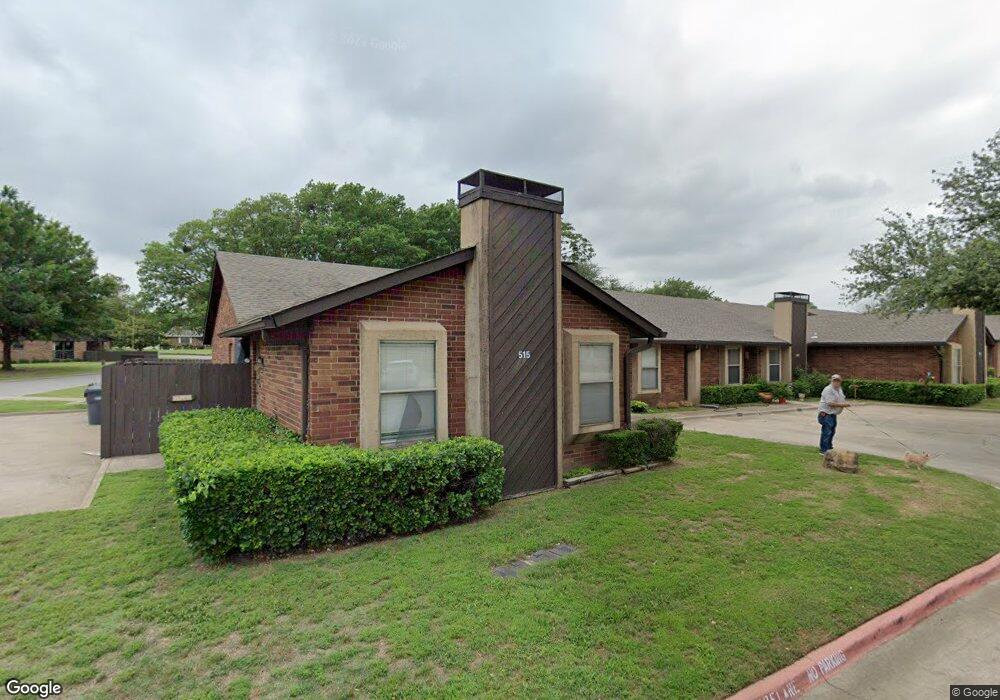
515 Railhead Loop Ardmore, OK 73401
Estimated Value: $116,000 - $161,000
2
Beds
1
Bath
1,072
Sq Ft
$127/Sq Ft
Est. Value
About This Home
This home is located at 515 Railhead Loop, Ardmore, OK 73401 and is currently estimated at $136,667, approximately $127 per square foot. 515 Railhead Loop is a home located in Carter County with nearby schools including Plainview Primary School, Plainview Intermediate School, and Plainview Middle School.
Ownership History
Date
Name
Owned For
Owner Type
Purchase Details
Closed on
Aug 22, 2024
Sold by
515 Railhead Loop Series
Bought by
Pearson Paul Eric and Pearson Kara N
Current Estimated Value
Home Financials for this Owner
Home Financials are based on the most recent Mortgage that was taken out on this home.
Original Mortgage
$93,855
Outstanding Balance
$91,003
Interest Rate
6.89%
Mortgage Type
New Conventional
Estimated Equity
$45,664
Purchase Details
Closed on
Jun 10, 2022
Sold by
Galoob Enterprises Llc
Bought by
Mak Galoob Llc
Purchase Details
Closed on
Jun 4, 2003
Sold by
Household Finance Corp Ii
Bought by
Galoob Lynda T and Galoob Harry
Purchase Details
Closed on
Feb 28, 1996
Sold by
Murphy Ralph W
Bought by
Sluice Kelly Murphy
Purchase Details
Closed on
Oct 18, 1995
Sold by
Sluice Kelly Murphy
Bought by
Sluice Kelly Murphy
Purchase Details
Closed on
Nov 3, 1994
Sold by
Murphy Ralph W
Bought by
Murphy Ralph W
Create a Home Valuation Report for This Property
The Home Valuation Report is an in-depth analysis detailing your home's value as well as a comparison with similar homes in the area
Home Values in the Area
Average Home Value in this Area
Purchase History
| Date | Buyer | Sale Price | Title Company |
|---|---|---|---|
| Pearson Paul Eric | $115,500 | Stewart Title | |
| Mak Galoob Llc | -- | Telschow Johnson Law Pllc | |
| Galoob Lynda T | $48,000 | -- | |
| Sluice Kelly Murphy | -- | -- | |
| Sluice Kelly Murphy | -- | -- | |
| Murphy Ralph W | -- | -- |
Source: Public Records
Mortgage History
| Date | Status | Borrower | Loan Amount |
|---|---|---|---|
| Open | Pearson Paul Eric | $93,855 |
Source: Public Records
Tax History Compared to Growth
Tax History
| Year | Tax Paid | Tax Assessment Tax Assessment Total Assessment is a certain percentage of the fair market value that is determined by local assessors to be the total taxable value of land and additions on the property. | Land | Improvement |
|---|---|---|---|---|
| 2025 | $1,393 | $13,860 | $1,733 | $12,127 |
| 2024 | $1,393 | $15,199 | $1,800 | $13,399 |
| 2023 | $1,326 | $14,475 | $1,800 | $12,675 |
| 2022 | $822 | $9,075 | $1,800 | $7,275 |
| 2021 | $805 | $8,642 | $1,862 | $6,780 |
| 2020 | $775 | $8,231 | $1,494 | $6,737 |
| 2019 | $719 | $7,839 | $2,048 | $5,791 |
| 2018 | $678 | $7,466 | $795 | $6,671 |
| 2017 | $649 | $7,111 | $745 | $6,366 |
| 2016 | $621 | $6,772 | $698 | $6,074 |
| 2015 | $609 | $6,450 | $240 | $6,210 |
| 2014 | $580 | $6,142 | $240 | $5,902 |
Source: Public Records
Map
Nearby Homes
- 35 Overland Route
- 36 Overland Route
- 58 Overland Route
- 5 Rio Grande
- 2412 S Rockford Pkwy
- 2410 Augusta Rd
- 3218 W Broadway St
- 0 N Rockford Rd Unit 2411009
- 0 N Rockford Rd Unit 2440723
- 811 Rosewood St
- 2222 Cloverleaf Place
- 1006 S Rockford Rd
- 2212 Cloverleaf Place
- 2200 Cloverleaf Place
- 820 Virginia Ln
- 3541 Highland Oaks Cir
- 3542 Highland Oaks Cir
- 535 Sunset Dr SW
- 0 N Plainview Rd Unit 23990353
- 3209 Myall St
- 513 Railhead Loop
- 511 Railhead Loop
- 509 Railhead Loop
- 514 Railhead Loop
- 35 Overland Route St
- 507 Railhead Loop
- 512 Railhead Loop
- 510 Railhead Loop
- 508 Railhead Loop
- 505 Railhead Loop
- 33 Overland Route St
- 36 Overland Route St
- 503 Railhead Loop
- 34 Overland Route St
- 504 Railhead Loop
- 31 Overland Route St
- 38 Overland Route St
- 38 Overland Route Unit 1
- 38 Overland Route Unit 38