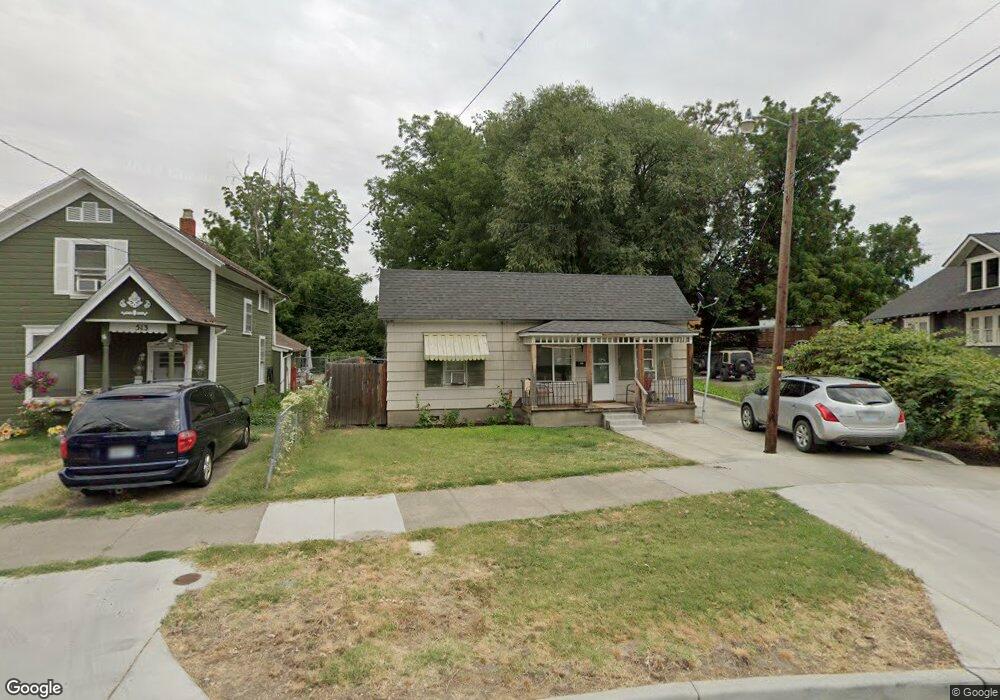
515 S 3rd Ave Walla Walla, WA 99362
Estimated Value: $197,000 - $211,277
2
Beds
1
Bath
720
Sq Ft
$284/Sq Ft
Est. Value
About This Home
This home is located at 515 S 3rd Ave, Walla Walla, WA 99362 and is currently estimated at $204,569, approximately $284 per square foot. 515 S 3rd Ave is a home located in Walla Walla County with nearby schools including Sharpstein Elementary School, Garrison Middle School, and Willow Public School.
Ownership History
Date
Name
Owned For
Owner Type
Purchase Details
Closed on
Aug 7, 2025
Sold by
1858 Investments Llc
Bought by
Niderost Gregory A and Niderost Darlene M
Current Estimated Value
Home Financials for this Owner
Home Financials are based on the most recent Mortgage that was taken out on this home.
Original Mortgage
$150,000
Outstanding Balance
$149,871
Interest Rate
6.77%
Mortgage Type
New Conventional
Estimated Equity
$54,698
Purchase Details
Closed on
Feb 11, 2020
Sold by
Walla Walla County
Bought by
1858 Investments Llc
Purchase Details
Closed on
Apr 10, 2012
Sold by
Stitt Grigg Patricia J
Bought by
Masters Pamela
Create a Home Valuation Report for This Property
The Home Valuation Report is an in-depth analysis detailing your home's value as well as a comparison with similar homes in the area
Purchase History
| Date | Buyer | Sale Price | Title Company |
|---|---|---|---|
| Niderost Gregory A | $200,000 | None Listed On Document | |
| 1858 Investments Llc | -- | None Available | |
| Masters Pamela | -- | None Available |
Source: Public Records
Mortgage History
| Date | Status | Borrower | Loan Amount |
|---|---|---|---|
| Open | Niderost Gregory A | $150,000 |
Source: Public Records
Tax History
| Year | Tax Paid | Tax Assessment Tax Assessment Total Assessment is a certain percentage of the fair market value that is determined by local assessors to be the total taxable value of land and additions on the property. | Land | Improvement |
|---|---|---|---|---|
| 2025 | $1,586 | $160,200 | $76,500 | $83,700 |
| 2024 | $1,406 | $160,200 | $76,500 | $83,700 |
| 2023 | $1,406 | $158,740 | $44,630 | $114,110 |
| 2022 | $1,233 | $120,710 | $44,630 | $76,080 |
| 2021 | $1,124 | $113,790 | $44,630 | $69,160 |
| 2020 | $1,111 | $94,030 | $44,630 | $49,400 |
| 2019 | $1,016 | $94,030 | $44,630 | $49,400 |
| 2018 | $1,206 | $94,030 | $44,630 | $49,400 |
| 2017 | $1,067 | $91,330 | $45,900 | $45,430 |
| 2016 | $1,122 | $87,200 | $45,900 | $41,300 |
| 2015 | $197 | $87,200 | $45,900 | $41,300 |
| 2014 | -- | $87,200 | $45,900 | $41,300 |
| 2013 | -- | $87,200 | $45,900 | $41,300 |
Source: Public Records
Map
Nearby Homes
Your Personal Tour Guide
Ask me questions while you tour the home.