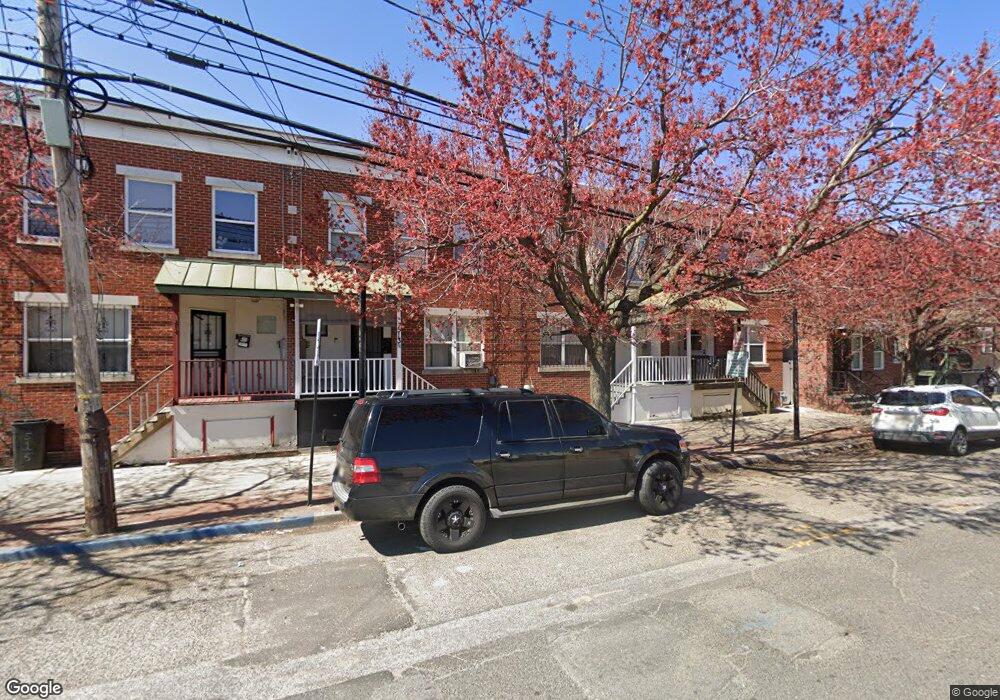
515 S 6th St Camden, NJ 08103
Lanning Square NeighborhoodEstimated Value: $202,748 - $296,000
--
Bed
--
Bath
1,266
Sq Ft
$188/Sq Ft
Est. Value
About This Home
This home is located at 515 S 6th St, Camden, NJ 08103 and is currently estimated at $237,437, approximately $187 per square foot. 515 S 6th St is a home located in Camden County with nearby schools including Camden High School, Hope Community Charter School, and Leap Academy University Charter School.
Ownership History
Date
Name
Owned For
Owner Type
Purchase Details
Closed on
Feb 14, 2008
Sold by
Camper Keith F
Bought by
Bey Jamila S
Current Estimated Value
Home Financials for this Owner
Home Financials are based on the most recent Mortgage that was taken out on this home.
Original Mortgage
$97,440
Outstanding Balance
$60,621
Interest Rate
5.8%
Mortgage Type
FHA
Estimated Equity
$176,816
Purchase Details
Closed on
Sep 12, 2005
Sold by
Nj Housing & Mtg Fin Agency
Bought by
Camper Keith
Purchase Details
Closed on
Feb 23, 1994
Sold by
Camden City Devt
Bought by
Davis Deborah
Home Financials for this Owner
Home Financials are based on the most recent Mortgage that was taken out on this home.
Original Mortgage
$55,000
Interest Rate
7.07%
Mortgage Type
Purchase Money Mortgage
Create a Home Valuation Report for This Property
The Home Valuation Report is an in-depth analysis detailing your home's value as well as a comparison with similar homes in the area
Home Values in the Area
Average Home Value in this Area
Purchase History
| Date | Buyer | Sale Price | Title Company |
|---|---|---|---|
| Bey Jamila S | $101,000 | -- | |
| Camper Keith | $50,000 | -- | |
| Davis Deborah | $55,000 | -- |
Source: Public Records
Mortgage History
| Date | Status | Borrower | Loan Amount |
|---|---|---|---|
| Open | Bey Jamila S | $97,440 | |
| Previous Owner | Davis Deborah | $55,000 |
Source: Public Records
Tax History Compared to Growth
Tax History
| Year | Tax Paid | Tax Assessment Tax Assessment Total Assessment is a certain percentage of the fair market value that is determined by local assessors to be the total taxable value of land and additions on the property. | Land | Improvement |
|---|---|---|---|---|
| 2025 | $3,175 | $89,600 | $7,300 | $82,300 |
| 2024 | $3,069 | $89,600 | $7,300 | $82,300 |
| 2023 | $3,069 | $89,600 | $7,300 | $82,300 |
| 2022 | $3,011 | $89,600 | $7,300 | $82,300 |
| 2021 | $2,815 | $89,600 | $7,300 | $82,300 |
| 2020 | $2,849 | $89,600 | $7,300 | $82,300 |
| 2019 | $2,728 | $89,600 | $7,300 | $82,300 |
| 2018 | $2,714 | $89,600 | $7,300 | $82,300 |
| 2017 | $2,648 | $89,600 | $7,300 | $82,300 |
| 2016 | $2,563 | $89,600 | $7,300 | $82,300 |
| 2015 | $2,468 | $89,600 | $7,300 | $82,300 |
| 2014 | $2,408 | $89,600 | $7,300 | $82,300 |
Source: Public Records
Map
Nearby Homes
- 601 Berkley St
- 700 New St Unit 308
- 711 Berkley St
- 803 Princeton Ave
- 513 Benson St
- 746 Pine St
- 715 S 8th St
- 718 Spruce St
- 724 Spruce St
- 418 Benson St
- 507 S 4th St
- 917 S 8th St
- 321 Washington St
- 318 Clinton St
- 764 Mount Vernon St
- 918 Mount Ephraim Ave
- 449 S 6th St
- 1042 S 4th St
- 107 N 6th St
- 1050 S 4th St