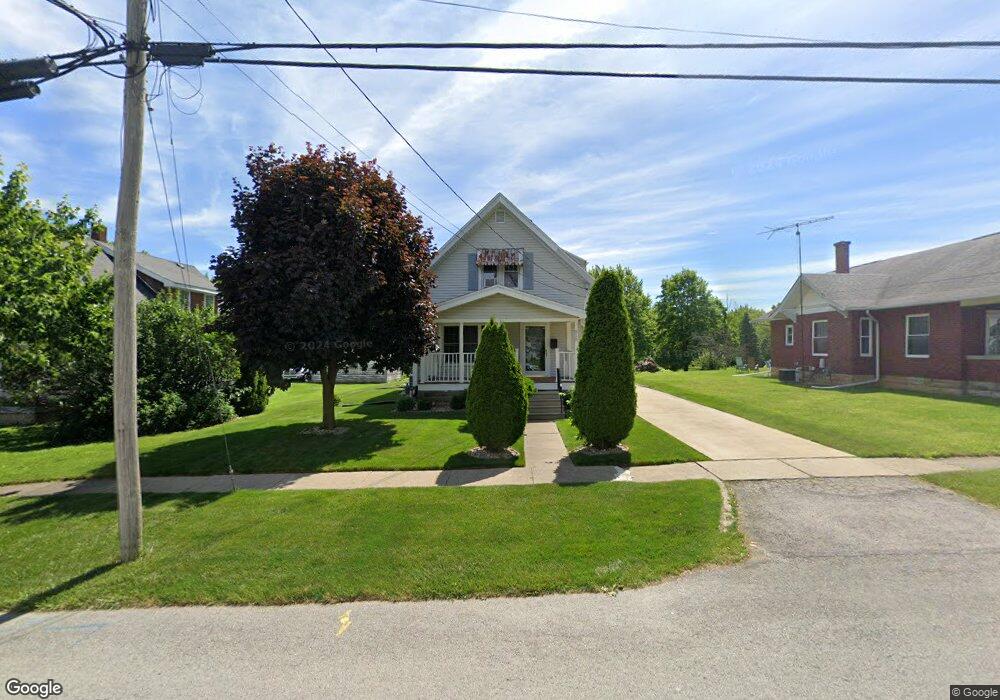
515 Spangler St Willard, OH 44890
Estimated Value: $133,000 - $146,000
3
Beds
1
Bath
1,172
Sq Ft
$118/Sq Ft
Est. Value
About This Home
This home is located at 515 Spangler St, Willard, OH 44890 and is currently estimated at $138,127, approximately $117 per square foot. 515 Spangler St is a home located in Huron County with nearby schools including Willard Middle/High School, Celeryville Christian School, and St Francis Xavier School.
Ownership History
Date
Name
Owned For
Owner Type
Purchase Details
Closed on
Aug 7, 2003
Bought by
Velazquez Ervin M
Current Estimated Value
Purchase Details
Closed on
Jun 1, 1999
Sold by
Nutter Donald K
Bought by
Ousley Adam R
Home Financials for this Owner
Home Financials are based on the most recent Mortgage that was taken out on this home.
Original Mortgage
$52,100
Interest Rate
6.92%
Mortgage Type
New Conventional
Purchase Details
Closed on
Aug 18, 1988
Bought by
Nutter Donald K
Create a Home Valuation Report for This Property
The Home Valuation Report is an in-depth analysis detailing your home's value as well as a comparison with similar homes in the area
Home Values in the Area
Average Home Value in this Area
Purchase History
| Date | Buyer | Sale Price | Title Company |
|---|---|---|---|
| Velazquez Ervin M | $92,000 | -- | |
| Ousley Adam R | $54,900 | -- | |
| Nutter Donald K | $25,000 | -- |
Source: Public Records
Mortgage History
| Date | Status | Borrower | Loan Amount |
|---|---|---|---|
| Previous Owner | Ousley Adam R | $52,100 |
Source: Public Records
Tax History
| Year | Tax Paid | Tax Assessment Tax Assessment Total Assessment is a certain percentage of the fair market value that is determined by local assessors to be the total taxable value of land and additions on the property. | Land | Improvement |
|---|---|---|---|---|
| 2024 | $1,378 | $39,670 | $7,430 | $32,240 |
| 2023 | $1,371 | $32,030 | $5,780 | $26,250 |
| 2022 | $1,219 | $32,030 | $5,780 | $26,250 |
| 2021 | $1,219 | $32,030 | $5,780 | $26,250 |
| 2020 | $964 | $24,560 | $4,660 | $19,900 |
| 2019 | $989 | $24,560 | $4,660 | $19,900 |
| 2018 | $975 | $24,560 | $4,660 | $19,900 |
| 2017 | $867 | $21,870 | $4,660 | $17,210 |
| 2016 | $861 | $21,870 | $4,660 | $17,210 |
| 2015 | $852 | $21,890 | $4,670 | $17,220 |
| 2014 | $1,064 | $26,960 | $4,660 | $22,300 |
| 2013 | $1,016 | $26,960 | $4,660 | $22,300 |
Source: Public Records
Map
Nearby Homes
Your Personal Tour Guide
Ask me questions while you tour the home.