Estimated Value: $23,000 - $403,000
7
Beds
1
Bath
2,043
Sq Ft
$123/Sq Ft
Est. Value
About This Home
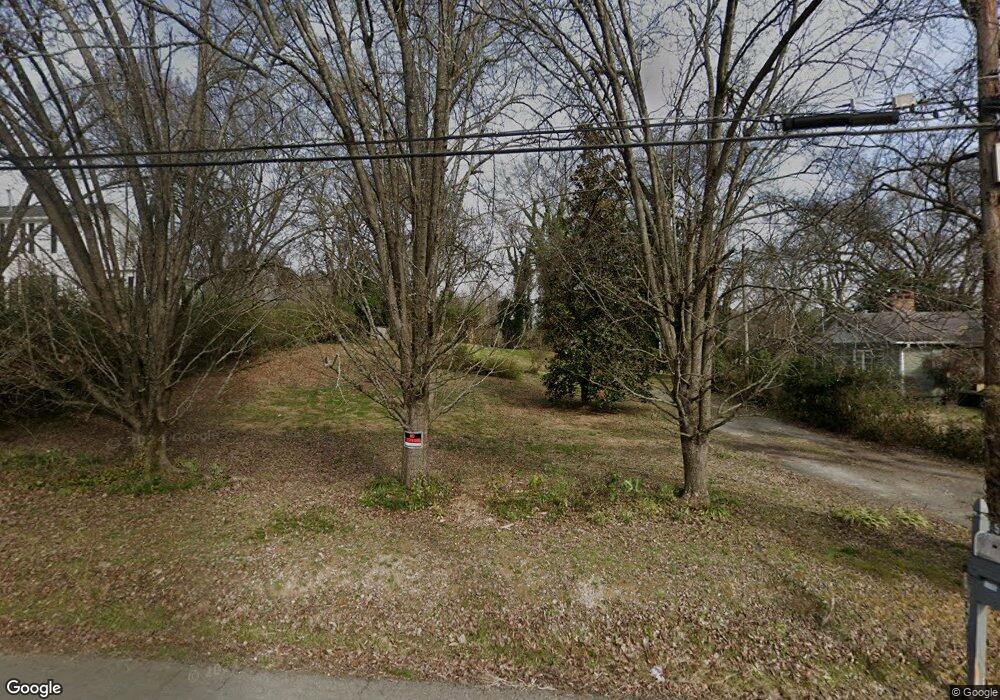
This home is located at 515 W 11th St NE, Rome, GA 30165 and is currently estimated at $251,000, approximately $122 per square foot. 515 W 11th St NE is a home located in Floyd County with nearby schools including Rome High School, St. Mary School, and Darlington School.
Ownership History
Date
Name
Owned For
Owner Type
Purchase Details
Closed on
May 15, 1997
Sold by
Morgan Melissa
Bought by
Gay Charles F
Current Estimated Value
Purchase Details
Closed on
Apr 26, 1997
Sold by
Gay Charles F
Bought by
Odum Timothy
Purchase Details
Closed on
May 29, 1992
Sold by
Gay Charles F
Bought by
Morgan Melissa
Purchase Details
Closed on
Jan 7, 1992
Sold by
Bramlett Jerry and Bramlett Katherine
Bought by
Gay Charles F
Purchase Details
Closed on
Jul 13, 1990
Sold by
Gay Loray
Bought by
Bramlett Jerry and Bramlett Katherine
Purchase Details
Closed on
Jan 31, 1985
Sold by
Gay Loray and Gay Helen
Bought by
Gay Loray
Purchase Details
Closed on
Mar 22, 1979
Sold by
Gibson Edna R
Bought by
Gay Loray and Gay Helen
Purchase Details
Closed on
Jan 1, 1950
Sold by
Gibson Edna R
Bought by
Gibson Edna R
Purchase Details
Closed on
Jan 2, 1901
Sold by
Gibson Harris R
Bought by
Gibson Edna R
Purchase Details
Closed on
Jan 1, 1901
Bought by
Gibson Harris R
Create a Home Valuation Report for This Property
The Home Valuation Report is an in-depth analysis detailing your home's value as well as a comparison with similar homes in the area
Home Values in the Area
Average Home Value in this Area
Purchase History
| Date | Buyer | Sale Price | Title Company |
|---|---|---|---|
| Gay Charles F | -- | -- | |
| Odum Timothy | $45,000 | -- | |
| Morgan Melissa | $35,000 | -- | |
| Gay Charles F | $44,100 | -- | |
| Bramlett Jerry | $45,000 | -- | |
| Gay Loray | -- | -- | |
| Gay Loray | $11,000 | -- | |
| Gibson Edna R | -- | -- | |
| Gibson Edna R | -- | -- | |
| Gibson Harris R | -- | -- |
Source: Public Records
Tax History Compared to Growth
Tax History
| Year | Tax Paid | Tax Assessment Tax Assessment Total Assessment is a certain percentage of the fair market value that is determined by local assessors to be the total taxable value of land and additions on the property. | Land | Improvement |
|---|---|---|---|---|
| 2024 | $329 | $8,357 | $8,357 | $0 |
| 2023 | $296 | $7,428 | $7,428 | $0 |
| 2022 | $1,085 | $41,690 | $6,190 | $35,500 |
| 2021 | $956 | $33,356 | $6,190 | $27,166 |
| 2020 | $850 | $26,991 | $4,643 | $22,348 |
| 2019 | $821 | $25,689 | $4,643 | $21,046 |
| 2018 | $798 | $24,386 | $4,643 | $19,743 |
| 2017 | $785 | $23,587 | $4,643 | $18,944 |
| 2016 | $838 | $26,520 | $4,640 | $21,880 |
| 2015 | -- | $27,370 | $4,640 | $22,730 |
| 2014 | -- | $27,370 | $4,640 | $22,730 |
Source: Public Records
Map
Nearby Homes
- 527 W 11th St NE
- 601 W 10th St NE
- 1006 Avenue A NE
- 1018 N 2nd Ave NW
- 1005 N 2nd Ave NW Unit 39
- PEARSON Plan at Shorter Village
- 4 Colonial Dr NW
- 0 Unbridled Rd Unit 22 23074684
- 6 Horseleg Creek Rd SW
- 204 Oakwood St NW
- 7 Raymond Ave NW
- 1 E 3rd Ave Unit 302
- 115 Ross St NE
- 110 Smith St NE
- 31 Ross St NE
- 106 Ross St NE
- 119 Jackson St NE
- 204 E 5th Ave
- 15 Heard St
- 13 Heard St NE
- 519 W 11th St NE
- 519 W 11th St NE
- 511 W 11th St NE Unit C
- 509 W 11th St NE
- 503A W 11th St NE Unit C
- 506 W 11th St NE
- W W 12th St
- 529 W 11th St NE
- 534 W 12th St NE
- 1010 N 5th Ave NE
- 519 W 12th St NE
- 1012 N 5th Ave NE
- 536 W 12th St NE
- 517 W 12th St NE
- 1109 Avenue B NE
- 0 Oostanaula Dr NE Unit Lot 23 & 24 8298266
- 0 Oostanaula Dr NE Unit 6875939
- 0 Oostanaula Dr NE Unit 8968833
- 0 Oostanaula Dr NE Unit 8867834
- 0 Oostanaula Dr NE Unit 8710637