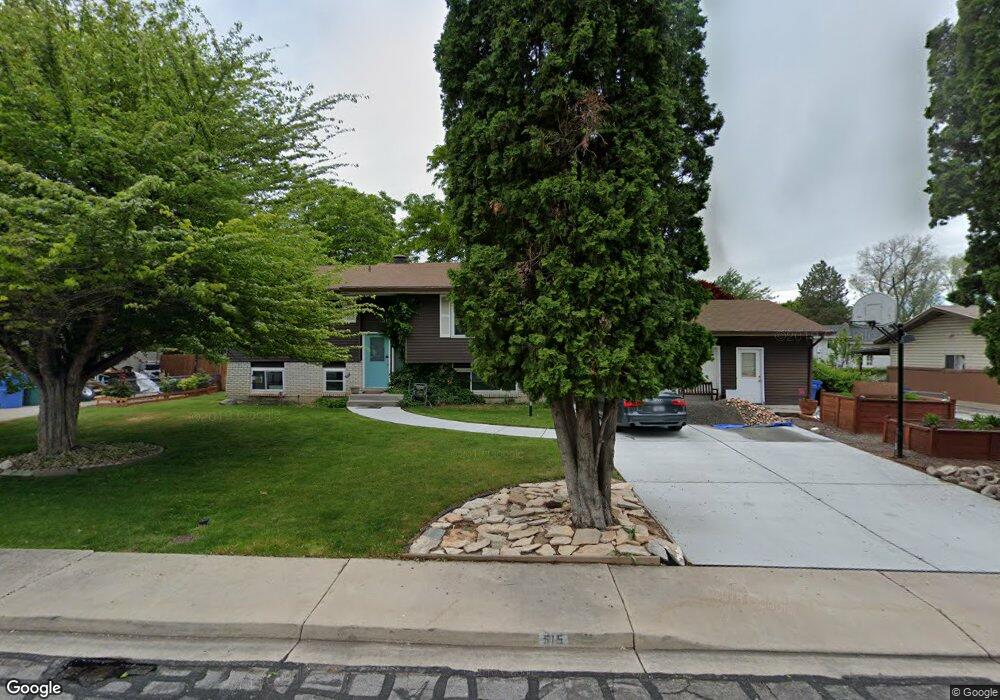
515 W 1600 S Orem, UT 84058
Lakeview NeighborhoodEstimated Value: $475,000 - $535,184
4
Beds
2
Baths
2,200
Sq Ft
$234/Sq Ft
Est. Value
About This Home
This home is located at 515 W 1600 S, Orem, UT 84058 and is currently estimated at $515,046, approximately $234 per square foot. 515 W 1600 S is a home located in Utah County with nearby schools including Westmore Elementary School, Lakeridge Jr High School, and Mountain View High School.
Ownership History
Date
Name
Owned For
Owner Type
Purchase Details
Closed on
May 14, 2009
Sold by
Negron Carmen
Bought by
Matthews Timothy and Negron Carmen
Current Estimated Value
Home Financials for this Owner
Home Financials are based on the most recent Mortgage that was taken out on this home.
Original Mortgage
$145,000
Interest Rate
4.71%
Mortgage Type
New Conventional
Purchase Details
Closed on
Nov 3, 1999
Sold by
Putnam Jack C
Bought by
Negron Carmen
Home Financials for this Owner
Home Financials are based on the most recent Mortgage that was taken out on this home.
Original Mortgage
$139,650
Interest Rate
7.75%
Purchase Details
Closed on
Jun 26, 1996
Sold by
Simonsen J Lawrence and Simonsen Marjorie J
Bought by
Putnam Jack C and Putnam Isabel C
Home Financials for this Owner
Home Financials are based on the most recent Mortgage that was taken out on this home.
Original Mortgage
$107,362
Interest Rate
8.09%
Mortgage Type
FHA
Create a Home Valuation Report for This Property
The Home Valuation Report is an in-depth analysis detailing your home's value as well as a comparison with similar homes in the area
Home Values in the Area
Average Home Value in this Area
Purchase History
| Date | Buyer | Sale Price | Title Company |
|---|---|---|---|
| Matthews Timothy | -- | Surety Title | |
| Negron Carmen | -- | Backman Stewart Title | |
| Putnam Jack C | -- | -- |
Source: Public Records
Mortgage History
| Date | Status | Borrower | Loan Amount |
|---|---|---|---|
| Closed | Matthews Timothy | $145,000 | |
| Closed | Negron Carmen | $139,650 | |
| Previous Owner | Putnam Jack C | $107,362 |
Source: Public Records
Tax History
| Year | Tax Paid | Tax Assessment Tax Assessment Total Assessment is a certain percentage of the fair market value that is determined by local assessors to be the total taxable value of land and additions on the property. | Land | Improvement |
|---|---|---|---|---|
| 2025 | $2,138 | $279,730 | -- | -- |
| 2024 | $1,974 | $261,470 | $0 | $0 |
| 2023 | $1,990 | $259,435 | $0 | $0 |
| 2022 | $1,990 | $253,330 | $0 | $0 |
| 2021 | $1,851 | $356,900 | $185,500 | $171,400 |
| 2020 | $1,537 | $316,400 | $148,400 | $168,000 |
| 2019 | $1,537 | $303,000 | $148,400 | $154,600 |
| 2018 | $1,429 | $269,100 | $130,300 | $138,800 |
| 2017 | $1,356 | $136,840 | $0 | $0 |
| 2016 | $0 | $115,775 | $0 | $0 |
| 2015 | -- | $106,865 | $0 | $0 |
| 2014 | -- | $101,585 | $0 | $0 |
Source: Public Records
Map
Nearby Homes
- 467 W 1640 S
- 355 W 1700 S
- 302 W Hidden Hollow Dr
- 458 W 1840 S
- 1675 S Lakewood Dr
- 1710 S 165 W
- 1490 S 135 W
- 1700 S Sandhill Rd Unit F401
- 2939 W 1930 N
- 1395 S 1020 W
- 1899 S 1030 W
- 34 E 1600 S
- 1755 S Main St
- 1680 S 50 E
- 1037 W 1360 S
- 1874 S Main St
- 1758 S 50 E
- 108 W 2070 S
- 1924 S 1120 W
- 1942 S 1140 W Unit 725
- 529 W 1600 S
- 501 W 1600 S
- 514 W 1640 S
- 500 W 1640 S
- 516 W 1600 S
- 1617 Wildwood Hollow
- 477 W 1600 S
- 502 W 1600 S
- 1647 Wildwood Hollow
- 530 W 1600 S
- 476 W 1640 S
- 470 W 1600 S Unit 476
- 470 W 1600 S Unit 470
- 478 W 1600 S
- 542 W 1600 S
- 463 W 1600 S
- 1664 S Wildwood Hollow Dr
- 1664 Wildwood Hollow
- 1656 S 500 W
- 1640 Wildwood Hollow
Your Personal Tour Guide
Ask me questions while you tour the home.