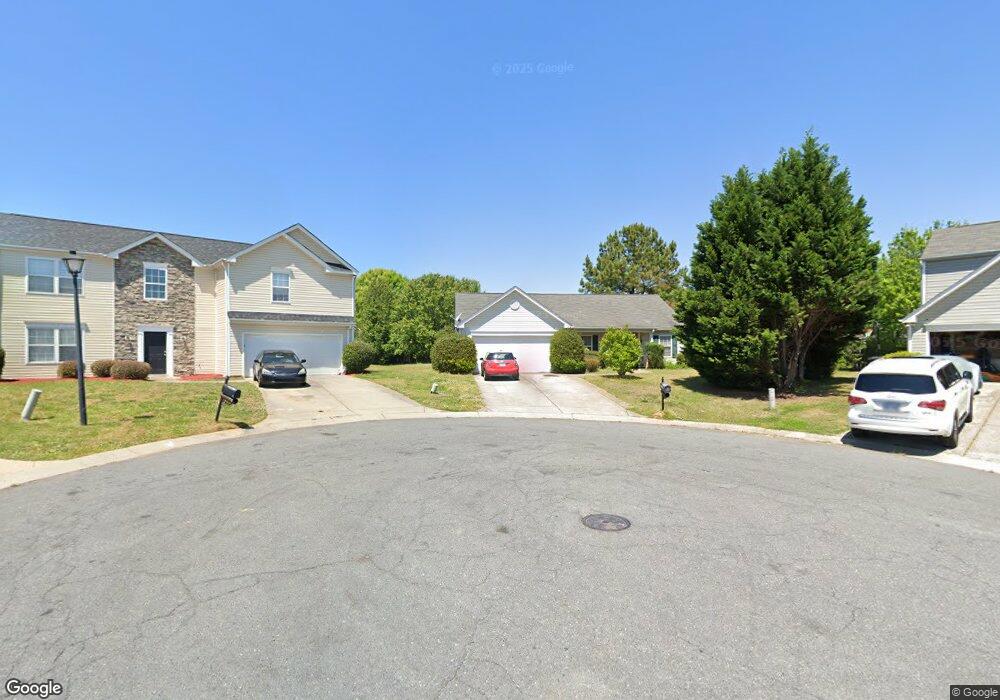
5150 Avening Ct Charlotte, NC 28215
Bradfield Farms NeighborhoodEstimated Value: $342,000 - $414,000
3
Beds
2
Baths
1,809
Sq Ft
$204/Sq Ft
Est. Value
About This Home
This home is located at 5150 Avening Ct, Charlotte, NC 28215 and is currently estimated at $368,783, approximately $203 per square foot. 5150 Avening Ct is a home located in Mecklenburg County with nearby schools including Clear Creek Elementary, Northeast Middle, and Rocky River High School.
Ownership History
Date
Name
Owned For
Owner Type
Purchase Details
Closed on
Feb 22, 2013
Sold by
Secretary Of H U D Of Washington D C
Bought by
Thr North Carolina Ii Lp
Current Estimated Value
Purchase Details
Closed on
Jul 23, 2012
Sold by
Leugers Joshua A
Bought by
Secretary Of Hud
Purchase Details
Closed on
Jun 2, 2009
Sold by
Secretary Of Housing & Urban Development
Bought by
Leugers Joshua A
Home Financials for this Owner
Home Financials are based on the most recent Mortgage that was taken out on this home.
Original Mortgage
$88,369
Interest Rate
4.77%
Mortgage Type
FHA
Purchase Details
Closed on
Jan 29, 2009
Sold by
Chesnok Yuriy V and Chesnok Lyudmila A
Bought by
Secretary Of Housing & Urban Development
Purchase Details
Closed on
Mar 28, 2000
Sold by
Colony Homes Llc
Bought by
Chesnok Yuriy and Chesnok Lyudmila A
Home Financials for this Owner
Home Financials are based on the most recent Mortgage that was taken out on this home.
Original Mortgage
$132,454
Interest Rate
8.38%
Mortgage Type
FHA
Create a Home Valuation Report for This Property
The Home Valuation Report is an in-depth analysis detailing your home's value as well as a comparison with similar homes in the area
Home Values in the Area
Average Home Value in this Area
Purchase History
| Date | Buyer | Sale Price | Title Company |
|---|---|---|---|
| Thr North Carolina Ii Lp | -- | None Available | |
| Secretary Of Hud | $94,744 | None Available | |
| Leugers Joshua A | -- | None Available | |
| Secretary Of Housing & Urban Development | $151,293 | None Available | |
| Chesnok Yuriy | $133,500 | First American Title |
Source: Public Records
Mortgage History
| Date | Status | Borrower | Loan Amount |
|---|---|---|---|
| Previous Owner | Leugers Joshua A | $88,369 | |
| Previous Owner | Chesnok Yuriy | $132,454 |
Source: Public Records
Tax History Compared to Growth
Tax History
| Year | Tax Paid | Tax Assessment Tax Assessment Total Assessment is a certain percentage of the fair market value that is determined by local assessors to be the total taxable value of land and additions on the property. | Land | Improvement |
|---|---|---|---|---|
| 2025 | $2,786 | $347,600 | $65,000 | $282,600 |
| 2024 | $2,786 | $347,600 | $65,000 | $282,600 |
| 2023 | $2,689 | $347,600 | $65,000 | $282,600 |
| 2022 | $1,898 | $183,700 | $30,000 | $153,700 |
| 2021 | $1,887 | $183,700 | $30,000 | $153,700 |
| 2020 | $1,880 | $183,700 | $30,000 | $153,700 |
| 2019 | $1,864 | $183,700 | $30,000 | $153,700 |
| 2018 | $1,580 | $114,800 | $15,300 | $99,500 |
| 2017 | $1,549 | $114,800 | $15,300 | $99,500 |
| 2016 | $1,539 | $114,800 | $15,300 | $99,500 |
| 2015 | $1,528 | $114,800 | $15,300 | $99,500 |
| 2014 | $1,536 | $114,800 | $15,300 | $99,500 |
Source: Public Records
Map
Nearby Homes
- 12015 Chantress Ln
- 12019 Serenade Ct
- 5924 Chumbley Point Rd Unit 85
- 6008 Chumbley Point Rd Unit 76
- 5932 Stewarts Landing Rd Unit 83
- 5944 Chumbley Point Rd Unit 80
- 5852 Stewarts Landing Rd Unit 93
- 5134 Tracewood Ct
- 5843 Stewarts Landing Rd Unit 71
- 5848 Stewarts Landing Rd Unit 94
- 5835 Stewarts Landing Rd Unit 69
- 5840 Stewarts Landing Rd Unit 96
- 5832 Stewarts Landing Rd Unit 98
- 5231 Hatcher Creek Rd Unit 44
- 5219 Hatcher Creek Rd Unit 41
- 5824 Stewarts Landing Rd Unit 100
- 10219 Windtree Ln
- 5236 Hatcher Creek Rd Unit 52
- 5436 Scarlet Sage Dr
- 5711 Stewarts Landing Rd
- 5146 Avening Ct
- 5154 Avening Ct
- 12022 Chantress Ln
- 12016 Chantress Ln
- 9822 Aventide Ln
- 9818 Aventide Ln
- 9828 Aventide Ln
- 12028 Chantress Ln
- 5142 Avening Ct
- 5149 Avening Ct
- 9812 Aventide Ln
- 9832 Aventide Ln
- 12034 Chantress Ln
- 12034 Chantress Ln Unit 111
- 5145 Avening Ct
- 5138 Avening Ct
- 9806 Aventide Ln
- 5141 Avening Ct
- 12040 Chantress Ln
- 12021 Chantress Ln