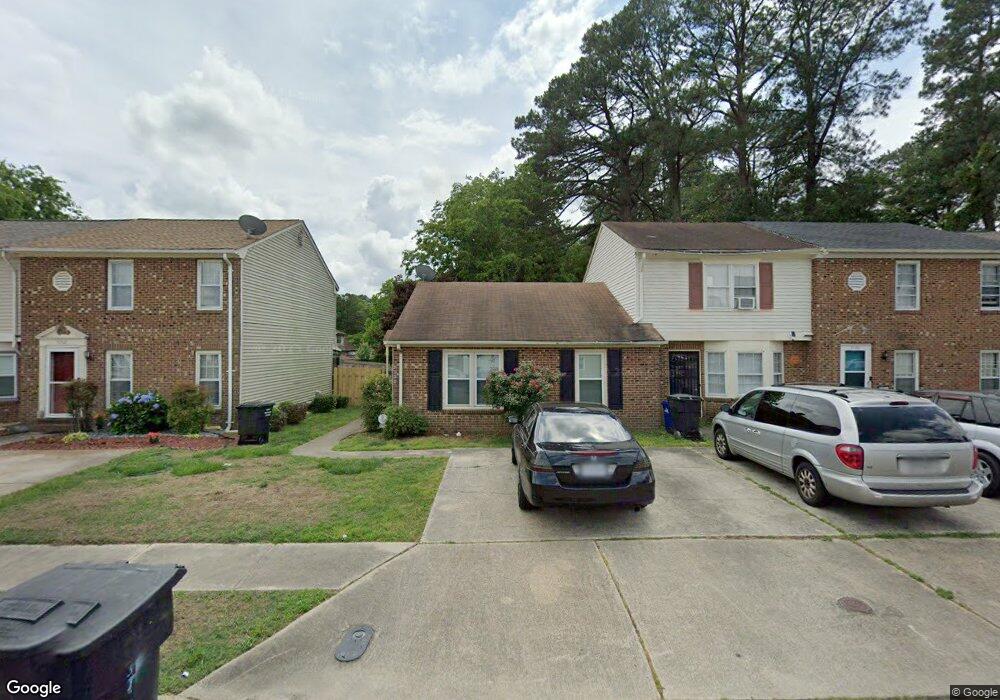
5150 Castle Way Portsmouth, VA 23703
Churchland NeighborhoodEstimated Value: $168,000 - $201,000
2
Beds
1
Bath
875
Sq Ft
$208/Sq Ft
Est. Value
About This Home
This home is located at 5150 Castle Way, Portsmouth, VA 23703 and is currently estimated at $182,100, approximately $208 per square foot. 5150 Castle Way is a home located in Portsmouth City with nearby schools including Churchland Elementary School, Churchland Academy Elementary School, and Churchland Middle School.
Ownership History
Date
Name
Owned For
Owner Type
Purchase Details
Closed on
Aug 26, 2015
Sold by
Gonzales David and Gonzales Mary
Bought by
Walden Stephanie L
Current Estimated Value
Home Financials for this Owner
Home Financials are based on the most recent Mortgage that was taken out on this home.
Original Mortgage
$83,460
Outstanding Balance
$64,826
Interest Rate
3.75%
Mortgage Type
FHA
Estimated Equity
$117,274
Purchase Details
Closed on
Nov 20, 2006
Sold by
Duncan Julie E
Bought by
Gonzales David
Home Financials for this Owner
Home Financials are based on the most recent Mortgage that was taken out on this home.
Original Mortgage
$110,000
Interest Rate
6.4%
Mortgage Type
New Conventional
Purchase Details
Closed on
Aug 28, 2000
Sold by
Boxton Ralph W
Bought by
Ellis Julie B
Home Financials for this Owner
Home Financials are based on the most recent Mortgage that was taken out on this home.
Original Mortgage
$57,738
Interest Rate
8.06%
Create a Home Valuation Report for This Property
The Home Valuation Report is an in-depth analysis detailing your home's value as well as a comparison with similar homes in the area
Home Values in the Area
Average Home Value in this Area
Purchase History
| Date | Buyer | Sale Price | Title Company |
|---|---|---|---|
| Walden Stephanie L | $85,000 | None Available | |
| Gonzales David | $110,000 | -- | |
| Ellis Julie B | $58,500 | -- |
Source: Public Records
Mortgage History
| Date | Status | Borrower | Loan Amount |
|---|---|---|---|
| Open | Walden Stephanie L | $83,460 | |
| Previous Owner | Gonzales David | $110,000 | |
| Previous Owner | Ellis Julie B | $57,738 |
Source: Public Records
Tax History Compared to Growth
Tax History
| Year | Tax Paid | Tax Assessment Tax Assessment Total Assessment is a certain percentage of the fair market value that is determined by local assessors to be the total taxable value of land and additions on the property. | Land | Improvement |
|---|---|---|---|---|
| 2025 | $2,072 | $162,030 | $50,000 | $112,030 |
| 2024 | $2,072 | $154,520 | $50,000 | $104,520 |
| 2023 | $1,775 | $142,010 | $50,000 | $92,010 |
| 2022 | $1,364 | $104,960 | $25,000 | $79,960 |
| 2021 | $1,364 | $104,960 | $25,000 | $79,960 |
| 2020 | $1,364 | $104,960 | $25,000 | $79,960 |
| 2019 | $1,261 | $96,990 | $25,000 | $71,990 |
| 2018 | $1,261 | $96,990 | $25,000 | $71,990 |
| 2017 | $1,238 | $95,230 | $25,190 | $70,040 |
| 2016 | $1,238 | $95,230 | $25,190 | $70,040 |
| 2015 | $1,238 | $95,230 | $25,190 | $70,040 |
| 2014 | $1,344 | $105,820 | $25,190 | $80,630 |
Source: Public Records
Map
Nearby Homes
- 4011 Reese Dr S
- 3000 Ferguson Dr
- 5111 Sweetbriar Cir
- 5006 High St W
- 3205 Clover Hill Dr
- 3233 Clover Hill Dr
- 5221 High St W
- 5220 Clover Hill Dr
- 5302 High St W
- 3200 Westwood Crescent
- 3130 Sterling Point Dr
- 3128 Sterling Point Dr
- 5304 High St W
- 4417 Gannon Rd
- 2805 Acres Rd
- 3101 Laurel Ln
- 4707 High St W
- 4305 Manchester Rd
- 3425 Cedar Ln
- 3432 Carter Rd
- 5148 Castle Way
- 5152 Castle Way
- 5146 Castle Way
- 5154 Castle Way
- 5154 Castle Way Unit Way
- 5156 Castle Way
- 5144 Castle Way
- 5158 Castle Way
- 5160 Castle Way
- 5142 Castle Way
- 5135 Castle Way
- 4005 Reese Dr S
- 5162 Castle Way
- 5140 Castle Way
- 4007 Reese Dr S
- 5153 Castle Way
- 5155 Castle Way
- 5133 Castle Way
- 4009 Reese Dr S
- 5157 Castle Way