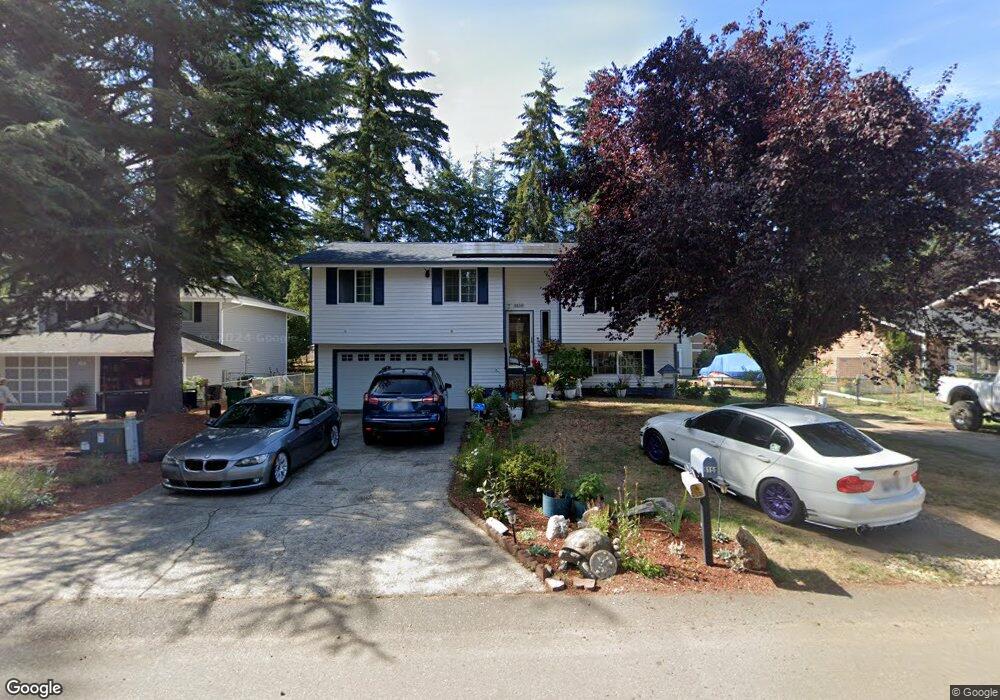
5150 Sherlyn Ave SE Port Orchard, WA 98367
Bethel NeighborhoodEstimated Value: $425,000 - $502,000
3
Beds
3
Baths
1,060
Sq Ft
$440/Sq Ft
Est. Value
About This Home
This home is located at 5150 Sherlyn Ave SE, Port Orchard, WA 98367 and is currently estimated at $466,044, approximately $439 per square foot. 5150 Sherlyn Ave SE is a home located in Kitsap County with nearby schools including Hidden Creek Elementary School, Marcus Whitman Middle School, and South Kitsap High School.
Ownership History
Date
Name
Owned For
Owner Type
Purchase Details
Closed on
Jan 15, 2002
Sold by
Pettit Arthur R and Pettit Leonora E
Bought by
Pettit Reynie A and Pettit Conchita S
Current Estimated Value
Home Financials for this Owner
Home Financials are based on the most recent Mortgage that was taken out on this home.
Original Mortgage
$91,500
Interest Rate
7.11%
Purchase Details
Closed on
Jun 23, 1995
Sold by
Washington Credit Union
Bought by
Pettit Arthur R and Pettit Leonora E
Home Financials for this Owner
Home Financials are based on the most recent Mortgage that was taken out on this home.
Original Mortgage
$85,000
Interest Rate
7.88%
Mortgage Type
Seller Take Back
Purchase Details
Closed on
Jan 13, 1995
Sold by
Mcdonald William J and Mcdonald Evie L
Bought by
Washington Credit Union
Create a Home Valuation Report for This Property
The Home Valuation Report is an in-depth analysis detailing your home's value as well as a comparison with similar homes in the area
Home Values in the Area
Average Home Value in this Area
Purchase History
| Date | Buyer | Sale Price | Title Company |
|---|---|---|---|
| Pettit Reynie A | -- | Transnation Title Insurance | |
| Pettit Arthur R | $85,000 | Stewart Title Co | |
| Washington Credit Union | $20,667 | -- |
Source: Public Records
Mortgage History
| Date | Status | Borrower | Loan Amount |
|---|---|---|---|
| Closed | Pettit Reynie A | $91,500 | |
| Closed | Pettit Arthur R | $85,000 |
Source: Public Records
Tax History Compared to Growth
Tax History
| Year | Tax Paid | Tax Assessment Tax Assessment Total Assessment is a certain percentage of the fair market value that is determined by local assessors to be the total taxable value of land and additions on the property. | Land | Improvement |
|---|---|---|---|---|
| 2026 | $3,491 | $424,030 | $77,070 | $346,960 |
| 2025 | $3,491 | $395,070 | $64,220 | $330,850 |
| 2024 | $3,385 | $395,070 | $64,220 | $330,850 |
| 2023 | $3,363 | $395,070 | $64,220 | $330,850 |
| 2022 | $3,301 | $324,980 | $59,970 | $265,010 |
| 2021 | $2,946 | $273,740 | $55,720 | $218,020 |
| 2020 | $2,888 | $260,700 | $53,070 | $207,630 |
| 2019 | $2,440 | $241,180 | $52,110 | $189,070 |
| 2018 | $2,560 | $196,830 | $52,110 | $144,720 |
| 2017 | $2,195 | $196,830 | $52,110 | $144,720 |
| 2016 | $2,159 | $177,260 | $52,110 | $125,150 |
| 2015 | $2,088 | $173,720 | $52,110 | $121,610 |
| 2014 | -- | $170,180 | $52,110 | $118,070 |
| 2013 | -- | $172,750 | $54,860 | $117,890 |
Source: Public Records
Map
Nearby Homes
- 5184 Granada Place SE
- 2426 SE Celebrity Ct
- 2430 SE Celebrity Ct
- 0 SE Sedgwick Rd Unit NWM2362855
- 0 SE Sedgwick Rd Unit 21804061
- 0 SE Sedgwick Rd Unit NWM2332354
- 4777 Okanogan Dr SE
- 5673 Bethel Rd SE Unit 28
- 4590 Laguna Ln SE
- 3341 SE Property Ct
- 5230 Bethel Rd SE
- 1612 SE Sylvis Ln
- 3365 SE Carmae Dr
- 1577 SE Oregon St
- 3707 SE Chesterton Dr
- 1116 Koda Cir SE
- 6146 Windlass Ave SE
- 1743 SE Crawford Rd
- 2948 SE Alson Ct
- 1164 Koda Cir SE
- 5120 Sherlyn Ave SE
- 2415 SE Converse Place
- 2411 SE Converse Place
- 5100 Sherlyn Ave SE
- 2412 SE Converse Place
- 5155 Sherlyn Ave SE
- 5135 Sherlyn Ave SE
- 5161 Sherlyn Ave SE
- 2407 SE Converse Place
- 5115 Sherlyn Ave SE
- 5070 Sherlyn Ave SE
- 2419 SE Celebrity Ct
- 2408 SE Converse Place
- 2413 SE Celebrity Ct
- 2425 SE Celebrity Ct
- 5085 Sherlyn Ave SE
- 2403 SE Converse Place
- 2407 SE Celebrity Ct
- 2431 SE Celebrity Ct
- 2405 SE Converse Cove