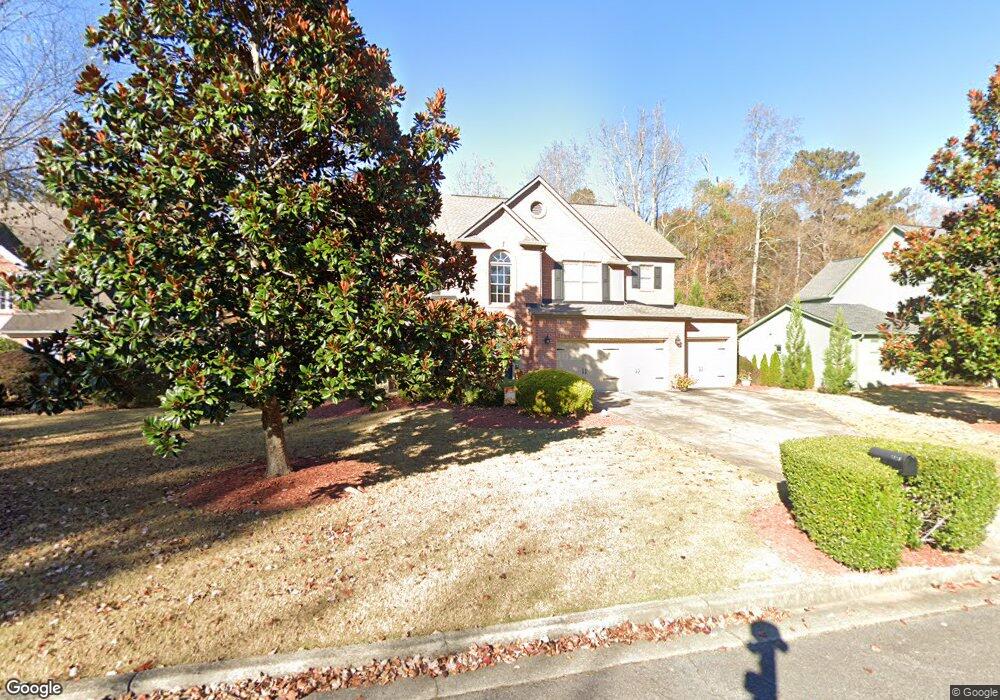
5150 Thamesgate Close Norcross, GA 30092
Estimated Value: $588,000 - $685,000
4
Beds
4
Baths
2,147
Sq Ft
$297/Sq Ft
Est. Value
About This Home
This home is located at 5150 Thamesgate Close, Norcross, GA 30092 and is currently estimated at $637,635, approximately $296 per square foot. 5150 Thamesgate Close is a home located in Gwinnett County with nearby schools including Simpson Elementary School, Pinckneyville Middle School, and Norcross High School.
Ownership History
Date
Name
Owned For
Owner Type
Purchase Details
Closed on
Jul 3, 2020
Sold by
Huffman Noah
Bought by
Huffman Noah Lee and Huffman Family Liv Trust
Current Estimated Value
Purchase Details
Closed on
Jan 16, 2007
Sold by
Hintz Hilmer and Hintz Vickie
Bought by
Huffman Noah
Home Financials for this Owner
Home Financials are based on the most recent Mortgage that was taken out on this home.
Original Mortgage
$255,900
Interest Rate
6.08%
Mortgage Type
New Conventional
Purchase Details
Closed on
Mar 27, 1998
Sold by
Gdt Homes
Bought by
Hintz Hilmer and Hintz Vickie
Home Financials for this Owner
Home Financials are based on the most recent Mortgage that was taken out on this home.
Original Mortgage
$167,650
Interest Rate
7.09%
Mortgage Type
New Conventional
Create a Home Valuation Report for This Property
The Home Valuation Report is an in-depth analysis detailing your home's value as well as a comparison with similar homes in the area
Home Values in the Area
Average Home Value in this Area
Purchase History
| Date | Buyer | Sale Price | Title Company |
|---|---|---|---|
| Huffman Noah Lee | -- | -- | |
| Huffman Noah | $319,900 | -- | |
| Hintz Hilmer | $209,600 | -- |
Source: Public Records
Mortgage History
| Date | Status | Borrower | Loan Amount |
|---|---|---|---|
| Previous Owner | Huffman Noah | $255,900 | |
| Previous Owner | Hintz Hilmer | $167,650 |
Source: Public Records
Tax History Compared to Growth
Tax History
| Year | Tax Paid | Tax Assessment Tax Assessment Total Assessment is a certain percentage of the fair market value that is determined by local assessors to be the total taxable value of land and additions on the property. | Land | Improvement |
|---|---|---|---|---|
| 2024 | $6,358 | $228,400 | $43,600 | $184,800 |
| 2023 | $6,358 | $228,400 | $43,600 | $184,800 |
| 2022 | $4,632 | $144,320 | $24,000 | $120,320 |
| 2021 | $4,725 | $144,320 | $24,000 | $120,320 |
| 2020 | $3,913 | $162,760 | $24,000 | $138,760 |
| 2019 | $3,774 | $106,000 | $24,000 | $82,000 |
| 2018 | $3,771 | $106,000 | $24,000 | $82,000 |
| 2016 | $3,466 | $98,400 | $24,000 | $74,400 |
| 2015 | $3,506 | $98,400 | $24,000 | $74,400 |
| 2014 | -- | $94,000 | $24,000 | $70,000 |
Source: Public Records
Map
Nearby Homes
- 5206 Creek Walk Cir
- 4916 Sudbrook Way Unit 253
- The Adams Plan at Waterside - Condos
- 4457 Watervale Way Unit 292
- 4477 Watervale Way Unit 286
- 5047 Shirley Oaks Dr Unit 313
- 4903 Sudbrook Way Unit 239
- The Stanley Plan at Waterside - Single Family
- The Stafford Plan at Waterside - Single Family
- 5039 Shirley Oaks Dr Unit 315
- 4479 Watervale Way Unit 285
- 5059 Shirley Oaks Dr Unit 309
- The Barrett II Plan at Waterside - Condos
- The Benton II Plan at Waterside - Townhomes
- 5134 Bandolino Ln Unit 320
- The Cascade Plan at Waterside - Condos
- The Grayson II Plan at Waterside - Single Family
- 5124 Bandolino Ln Unit 323
- The Grayson II Plan at Waterside - Townhomes
- 4923 Sudbrook Way Unit 233
- 5140 Thamesgate Close
- 5160 Thamesgate Close
- 5170 Thamesgate Close
- 5155 Thamesgate Close
- 5165 Thamesgate Close
- 5130 Thamesgate Close
- 5166 Creek Walk Cir
- 5110 Mainstream Cir
- 5120 Mainstream Cir
- 5105 Thamesgate Close
- 5130 Mainstream Cir
- 5120 Thamesgate Close
- 5156 Creek Walk Cir
- 4298 Millhouse Ln
- 4288 Millhouse Ln
- 5140 Mainstream Cir
- 5100 Mainstream Cir
- 5146 Creek Walk Cir
- 5150 Mainstream Cir Unit 2
- 5173 Creek Walk Cir