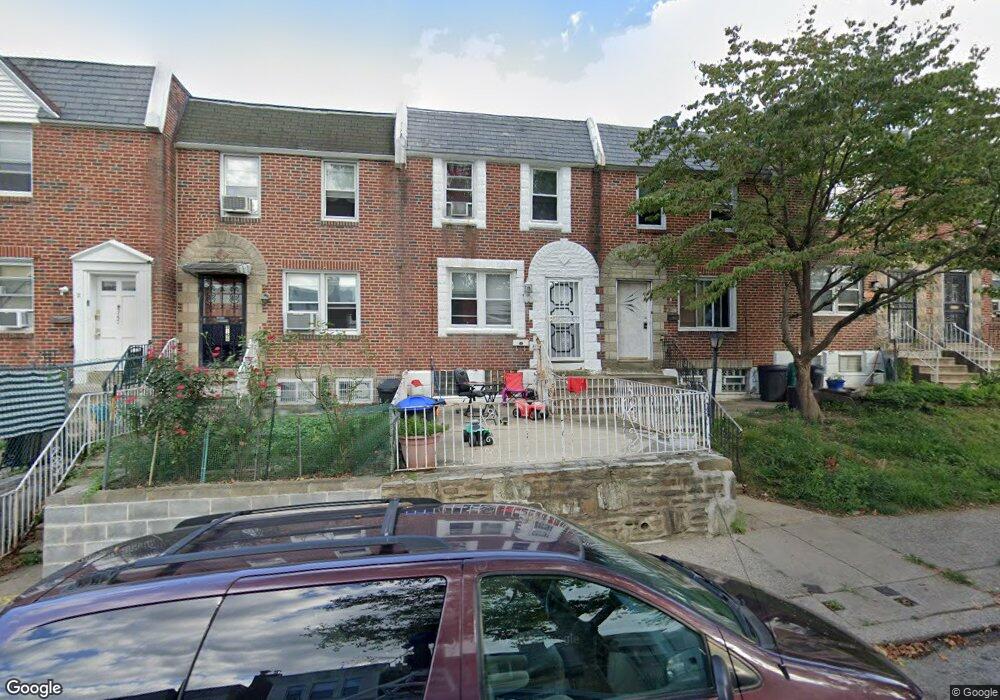
5153 Leiper St Philadelphia, PA 19124
Frankford NeighborhoodEstimated Value: $178,000 - $202,000
3
Beds
1
Bath
1,072
Sq Ft
$178/Sq Ft
Est. Value
About This Home
This home is located at 5153 Leiper St, Philadelphia, PA 19124 and is currently estimated at $191,233, approximately $178 per square foot. 5153 Leiper St is a home located in Philadelphia County with nearby schools including Frankford High School, The Philadelphia Charter School for the Arts & Sciences, and Mastery Schools Smedley Elementary.
Ownership History
Date
Name
Owned For
Owner Type
Purchase Details
Closed on
Oct 12, 2010
Sold by
Zheng Yong Yong and Chen Bi Yu
Bought by
Zheng Ming Q
Current Estimated Value
Purchase Details
Closed on
Sep 28, 2006
Sold by
Zheng Ming Q
Bought by
Zheng Yong Yong and Chen Bi Yu
Purchase Details
Closed on
Jan 15, 2004
Sold by
Stabelli Christina
Bought by
Zheng Ming Q
Home Financials for this Owner
Home Financials are based on the most recent Mortgage that was taken out on this home.
Original Mortgage
$43,400
Outstanding Balance
$20,198
Interest Rate
5.83%
Mortgage Type
Stand Alone First
Estimated Equity
$171,035
Purchase Details
Closed on
Jul 10, 2000
Sold by
Tort Wayne M and First Union National Bank
Bought by
Stabelli Christina
Create a Home Valuation Report for This Property
The Home Valuation Report is an in-depth analysis detailing your home's value as well as a comparison with similar homes in the area
Home Values in the Area
Average Home Value in this Area
Purchase History
| Date | Buyer | Sale Price | Title Company |
|---|---|---|---|
| Zheng Ming Q | $62,000 | None Available | |
| Zheng Yong Yong | -- | None Available | |
| Zheng Ming Q | $62,000 | Lawyers Title Ins | |
| Stabelli Christina | $15,600 | -- |
Source: Public Records
Mortgage History
| Date | Status | Borrower | Loan Amount |
|---|---|---|---|
| Open | Zheng Ming Q | $43,400 |
Source: Public Records
Tax History Compared to Growth
Tax History
| Year | Tax Paid | Tax Assessment Tax Assessment Total Assessment is a certain percentage of the fair market value that is determined by local assessors to be the total taxable value of land and additions on the property. | Land | Improvement |
|---|---|---|---|---|
| 2025 | $1,940 | $175,000 | $35,000 | $140,000 |
| 2024 | $1,940 | $175,000 | $35,000 | $140,000 |
| 2023 | $1,940 | $138,600 | $27,720 | $110,880 |
| 2022 | $1,348 | $138,600 | $27,720 | $110,880 |
| 2021 | $1,348 | $0 | $0 | $0 |
| 2020 | $1,348 | $0 | $0 | $0 |
| 2019 | $1,293 | $0 | $0 | $0 |
| 2018 | $1,291 | $0 | $0 | $0 |
| 2017 | $1,291 | $0 | $0 | $0 |
| 2016 | $1,291 | $0 | $0 | $0 |
| 2015 | $1,235 | $0 | $0 | $0 |
| 2014 | -- | $92,200 | $14,625 | $77,575 |
| 2012 | -- | $12,032 | $1,065 | $10,967 |
Source: Public Records
Map
Nearby Homes