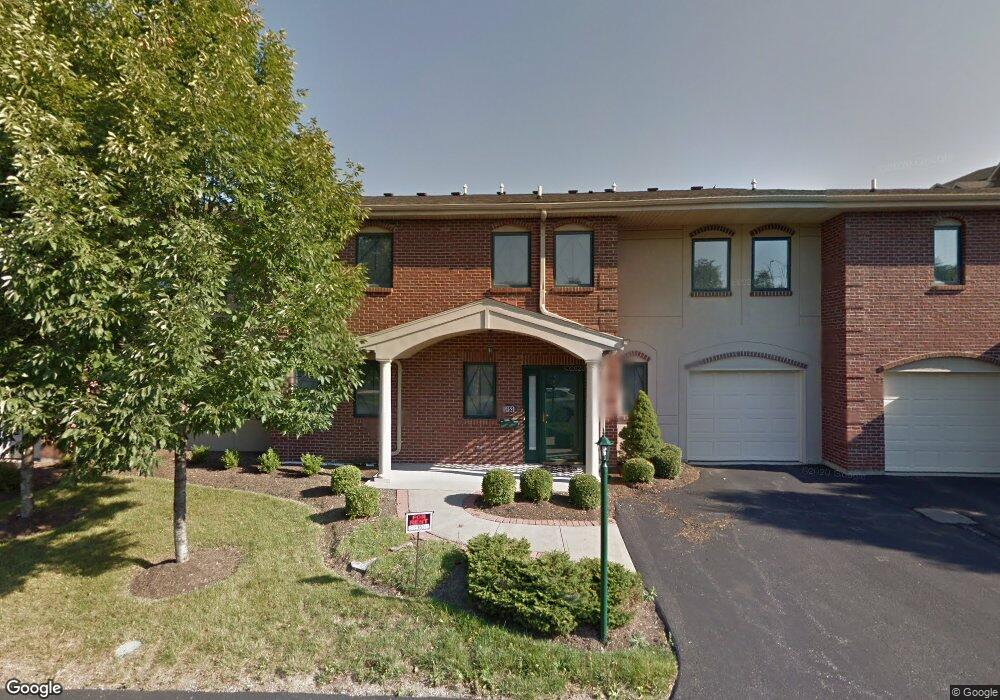
5153 N Bend Crossing Unit 10-6 Cincinnati, OH 45247
West Monfort Heights NeighborhoodEstimated Value: $183,000 - $228,000
2
Beds
2
Baths
1,545
Sq Ft
$135/Sq Ft
Est. Value
About This Home
This home is located at 5153 N Bend Crossing Unit 10-6, Cincinnati, OH 45247 and is currently estimated at $207,856, approximately $134 per square foot. 5153 N Bend Crossing Unit 10-6 is a home located in Hamilton County with nearby schools including Monfort Heights Elementary School, White Oak Middle School, and Colerain High School.
Ownership History
Date
Name
Owned For
Owner Type
Purchase Details
Closed on
Jan 30, 2023
Sold by
Esswein David L and Esswein Lavon S
Bought by
Stroube Debra L
Current Estimated Value
Purchase Details
Closed on
Oct 10, 2007
Sold by
Esswein Robert E
Bought by
Esswein David L and Esswein Lavon S
Home Financials for this Owner
Home Financials are based on the most recent Mortgage that was taken out on this home.
Original Mortgage
$90,000
Interest Rate
6.5%
Mortgage Type
Unknown
Purchase Details
Closed on
May 29, 2002
Sold by
S/Nbl Associates
Bought by
Campbell Roberta S
Create a Home Valuation Report for This Property
The Home Valuation Report is an in-depth analysis detailing your home's value as well as a comparison with similar homes in the area
Home Values in the Area
Average Home Value in this Area
Purchase History
| Date | Buyer | Sale Price | Title Company |
|---|---|---|---|
| Stroube Debra L | $165,000 | Springdale Title | |
| Esswein David L | $151,000 | Attorney | |
| Campbell Roberta S | $150,800 | -- |
Source: Public Records
Mortgage History
| Date | Status | Borrower | Loan Amount |
|---|---|---|---|
| Previous Owner | Esswein David L | $90,000 |
Source: Public Records
Tax History Compared to Growth
Tax History
| Year | Tax Paid | Tax Assessment Tax Assessment Total Assessment is a certain percentage of the fair market value that is determined by local assessors to be the total taxable value of land and additions on the property. | Land | Improvement |
|---|---|---|---|---|
| 2024 | $3,060 | $57,750 | $10,325 | $47,425 |
| 2023 | $3,172 | $57,750 | $10,325 | $47,425 |
| 2022 | $3,052 | $45,543 | $8,012 | $37,531 |
| 2021 | $2,856 | $45,543 | $8,012 | $37,531 |
| 2020 | $2,820 | $45,543 | $8,012 | $37,531 |
| 2019 | $2,868 | $41,783 | $7,350 | $34,433 |
| 2018 | $2,562 | $41,783 | $7,350 | $34,433 |
| 2017 | $2,455 | $41,783 | $7,350 | $34,433 |
| 2016 | $2,267 | $37,608 | $6,395 | $31,213 |
| 2015 | $2,257 | $37,608 | $6,395 | $31,213 |
| 2014 | $2,264 | $37,608 | $6,395 | $31,213 |
| 2013 | $2,439 | $43,225 | $7,350 | $35,875 |
Source: Public Records
Map
Nearby Homes
- 5440 Asbury Lake Dr
- 3775 Boomer Rd
- 5476 Audro Dr
- 4201 Boomer Rd
- 4491 W Fork Rd
- 3731 Ridgedale Dr
- 5538 Silverpoint Dr
- The McPherson Plan at Ivy Rose - Designer Collection
- Carrington Plan at Ivy Rose - Designer Collection
- Winston Plan at Ivy Rose - Designer Collection
- Calvin Plan at Ivy Rose - Designer Collection
- Miles Plan at Ivy Rose - Designer Collection
- Blair Plan at Ivy Rose - Designer Collection
- Magnolia Plan at Ivy Rose - Designer Collection
- Grandin Plan at Ivy Rose - Designer Collection
- Wyatt Plan at Ivy Rose - Designer Collection
- Avery Plan at Ivy Rose - Designer Collection
- Charles Plan at Ivy Rose - Designer Collection
- 4575 Boomer Rd
- 4628 Boomer Rd
- 5155 N Bend Crossing
- 5155 Northbend Crossing Unit 105
- 5161 N Bend Crossing
- 5161 Northbend Crossing Unit 101
- 5163 Northbend Crossing Unit 102
- 5153 Northbend Crossing Unit 106
- 5165 Northbend Crossing Unit 103
- 5167 N Bend Crossing
- 5163 Northbend Crossing
- 5151 N Bend Crossing
- 5151 Northbend Crossing Unit 107
- 5167 Northbend Crossing Unit 104
- 5109 N Bend Crossing
- 5109 Northbend Crossing Unit 135
- 5117 Northbend Crossing Unit 134
- 5107 Northbend Crossing Unit 136
- 5115 Northbend Crossing Unit 133
- 5113 Northbend Crossing Unit 132
- 5105 Northbend Crossing Unit 137
- 5111 Northbend Crossing Unit 131