Estimated Value: $361,000 - $402,000
4
Beds
1
Bath
1,172
Sq Ft
$331/Sq Ft
Est. Value
About This Home
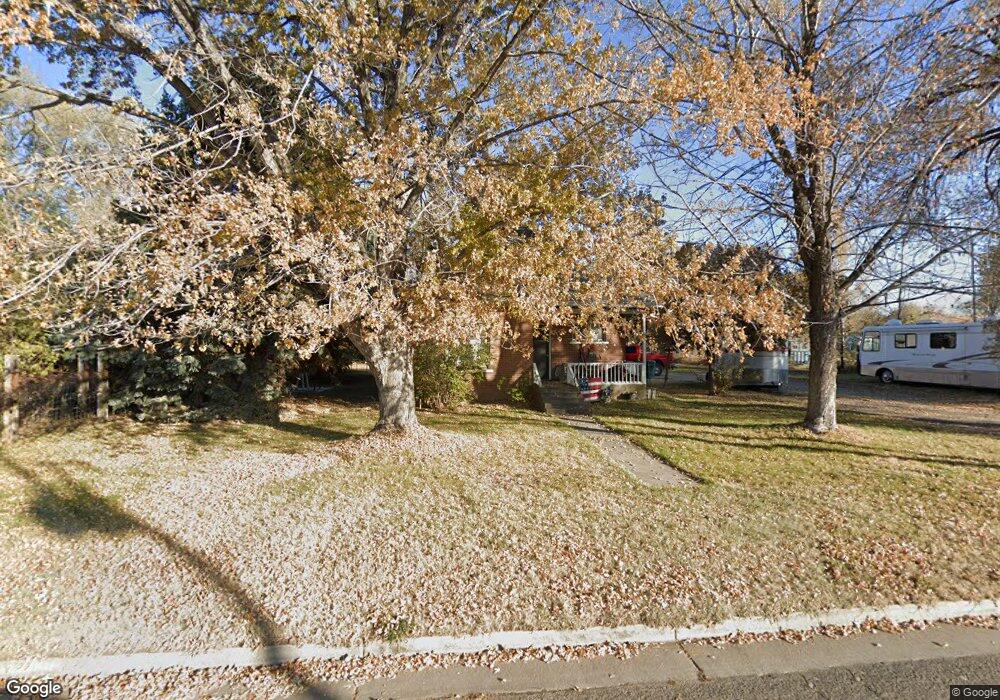
This home is located at 5154 S 2700 W, Roy, UT 84067 and is currently estimated at $388,044, approximately $331 per square foot. 5154 S 2700 W is a home located in Weber County with nearby schools including Midland School, Sand Ridge Junior High School, and Roy High School.
Ownership History
Date
Name
Owned For
Owner Type
Purchase Details
Closed on
May 1, 1998
Sold by
Terry Judy M
Bought by
Terry Douglas M
Current Estimated Value
Home Financials for this Owner
Home Financials are based on the most recent Mortgage that was taken out on this home.
Original Mortgage
$70,000
Interest Rate
6.57%
Purchase Details
Closed on
Dec 23, 1996
Sold by
Terry Douglas M
Bought by
Terry Douglas M and Terry Judy M
Home Financials for this Owner
Home Financials are based on the most recent Mortgage that was taken out on this home.
Original Mortgage
$71,000
Interest Rate
7.1%
Create a Home Valuation Report for This Property
The Home Valuation Report is an in-depth analysis detailing your home's value as well as a comparison with similar homes in the area
Home Values in the Area
Average Home Value in this Area
Purchase History
| Date | Buyer | Sale Price | Title Company |
|---|---|---|---|
| Terry Douglas M | -- | -- | |
| Terry Douglas M | -- | First American Title |
Source: Public Records
Mortgage History
| Date | Status | Borrower | Loan Amount |
|---|---|---|---|
| Previous Owner | Terry Douglas M | $70,000 | |
| Previous Owner | Terry Douglas M | $71,000 |
Source: Public Records
Tax History Compared to Growth
Tax History
| Year | Tax Paid | Tax Assessment Tax Assessment Total Assessment is a certain percentage of the fair market value that is determined by local assessors to be the total taxable value of land and additions on the property. | Land | Improvement |
|---|---|---|---|---|
| 2025 | $2,021 | $345,964 | $182,351 | $163,613 |
| 2024 | $1,952 | $341,997 | $182,374 | $159,623 |
| 2023 | $1,697 | $297,002 | $130,598 | $166,404 |
| 2022 | $1,622 | $289,001 | $123,002 | $165,999 |
| 2021 | $1,540 | $247,997 | $82,595 | $165,402 |
| 2020 | $1,419 | $210,999 | $82,595 | $128,404 |
| 2019 | $1,480 | $207,000 | $55,811 | $151,189 |
| 2018 | $1,499 | $198,001 | $52,856 | $145,145 |
| 2017 | $1,340 | $165,999 | $48,309 | $117,690 |
| 2016 | $1,166 | $80,075 | $22,375 | $57,700 |
| 2015 | $1,081 | $76,514 | $19,765 | $56,749 |
| 2014 | $1,089 | $72,954 | $19,765 | $53,189 |
Source: Public Records
Map
Nearby Homes