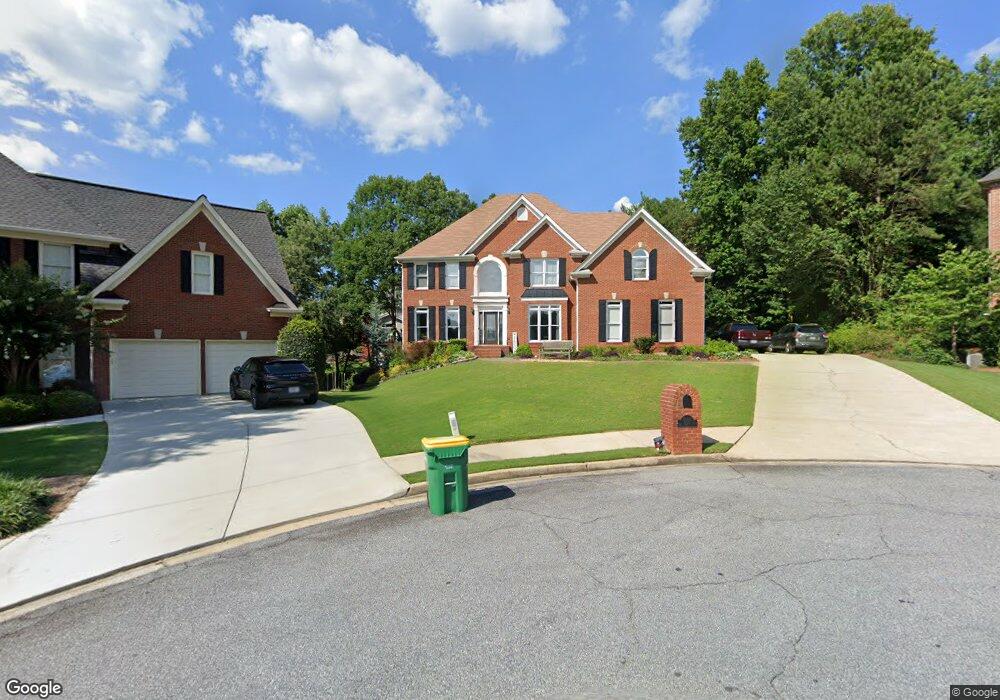
5155 Blue Yarrow Run Unit VIII Norcross, GA 30092
Estimated Value: $919,000 - $1,162,000
4
Beds
6
Baths
4,035
Sq Ft
$259/Sq Ft
Est. Value
About This Home
This home is located at 5155 Blue Yarrow Run Unit VIII, Norcross, GA 30092 and is currently estimated at $1,043,515, approximately $258 per square foot. 5155 Blue Yarrow Run Unit VIII is a home located in Gwinnett County with nearby schools including Simpson Elementary School, Pinckneyville Middle School, and Norcross High School.
Ownership History
Date
Name
Owned For
Owner Type
Purchase Details
Closed on
Jun 4, 2024
Sold by
Shiraishi Ray Weston
Bought by
Shiraishi Alana Rochelle Harris
Current Estimated Value
Purchase Details
Closed on
Apr 15, 2016
Sold by
Vashi Shreya D
Bought by
Shiraishi Ray and Shiraishi Alana R
Home Financials for this Owner
Home Financials are based on the most recent Mortgage that was taken out on this home.
Original Mortgage
$437,750
Interest Rate
3.73%
Mortgage Type
New Conventional
Purchase Details
Closed on
Jun 30, 1997
Sold by
John Willis Homes
Bought by
Vashi Dipak V and Vashi Shreya D
Home Financials for this Owner
Home Financials are based on the most recent Mortgage that was taken out on this home.
Original Mortgage
$200,000
Interest Rate
7.98%
Mortgage Type
New Conventional
Create a Home Valuation Report for This Property
The Home Valuation Report is an in-depth analysis detailing your home's value as well as a comparison with similar homes in the area
Home Values in the Area
Average Home Value in this Area
Purchase History
| Date | Buyer | Sale Price | Title Company |
|---|---|---|---|
| Shiraishi Alana Rochelle Harris | -- | -- | |
| Shiraishi Ray | $515,000 | -- | |
| Vashi Dipak V | $357,100 | -- |
Source: Public Records
Mortgage History
| Date | Status | Borrower | Loan Amount |
|---|---|---|---|
| Previous Owner | Shiraishi Ray | $437,750 | |
| Previous Owner | Vashi Dipak V | $200,000 |
Source: Public Records
Tax History Compared to Growth
Tax History
| Year | Tax Paid | Tax Assessment Tax Assessment Total Assessment is a certain percentage of the fair market value that is determined by local assessors to be the total taxable value of land and additions on the property. | Land | Improvement |
|---|---|---|---|---|
| 2024 | $10,789 | $362,000 | $67,600 | $294,400 |
| 2023 | $10,789 | $369,040 | $67,600 | $301,440 |
| 2022 | $10,085 | $326,760 | $62,000 | $264,760 |
| 2021 | $7,818 | $216,000 | $44,000 | $172,000 |
| 2020 | $7,867 | $216,000 | $44,000 | $172,000 |
| 2019 | $7,574 | $216,000 | $44,000 | $172,000 |
| 2018 | $7,601 | $216,000 | $44,000 | $172,000 |
| 2016 | $6,836 | $224,560 | $40,000 | $184,560 |
| 2015 | $6,573 | $209,560 | $36,000 | $173,560 |
| 2014 | $6,469 | $209,560 | $36,000 | $173,560 |
Source: Public Records
Map
Nearby Homes
- 5201 Edgerton Dr
- 0 Medlock Bridge Rd Unit 7311679
- 5018 Wickford Dr
- Olmstead Plan at Town Center Overlook
- Lynnwood Plan at Town Center Overlook
- 5064 Insperon Ln Unit 34
- 5062 Bridgeport Ln
- 3875 Ancroft Cir
- 5440 Clinchfield Trail
- 4860 Bush Rd
- 5206 Creek Walk Cir
- 4915 Millers Trace
- 4188 Riverview Dr
- 3630 Bridge Mill Ct Unit 2
- 5649 Whitesburg Ct
- 5067 Audley Ln
- 3239 Claudia Ct
- 5350 Wickershire Dr
- 3225 Claudia Place
- 4916 Sudbrook Way Unit 253
- 5155 Blue Yarrow Run NW
- 5150 Blue Yarrow Run
- 5165 Blue Yarrow Run
- 4004 Yarrow Bluff Unit VIII
- 5175 Blue Yarrow Run
- 5160 Wild Ginger Cove Unit VIII
- 5150 Wild Ginger Cove Unit VIII
- 5160 Blue Yarrow Run
- 5170 Blue Yarrow Run
- 5170 Wild Ginger Cove
- 4001 Yarrow Bluff Unit 847
- 4001 Yarrow Bluff
- 5185 Blue Yarrow Run Unit VIII
- 5180 Wild Ginger Cove Unit VIII
- 5190 Blue Yarrow Run
- 4011 Yarrow Bluff Unit VIII
- 5140 Wild Ginger Cove Unit 8
- 5195 Blue Yarrow Run Unit VIII
- 5155 Wild Ginger Cove
- 5190 Wild Ginger Cove