Estimated Value: $335,222 - $445,000
Studio
--
Bath
1,920
Sq Ft
$206/Sq Ft
Est. Value
About This Home
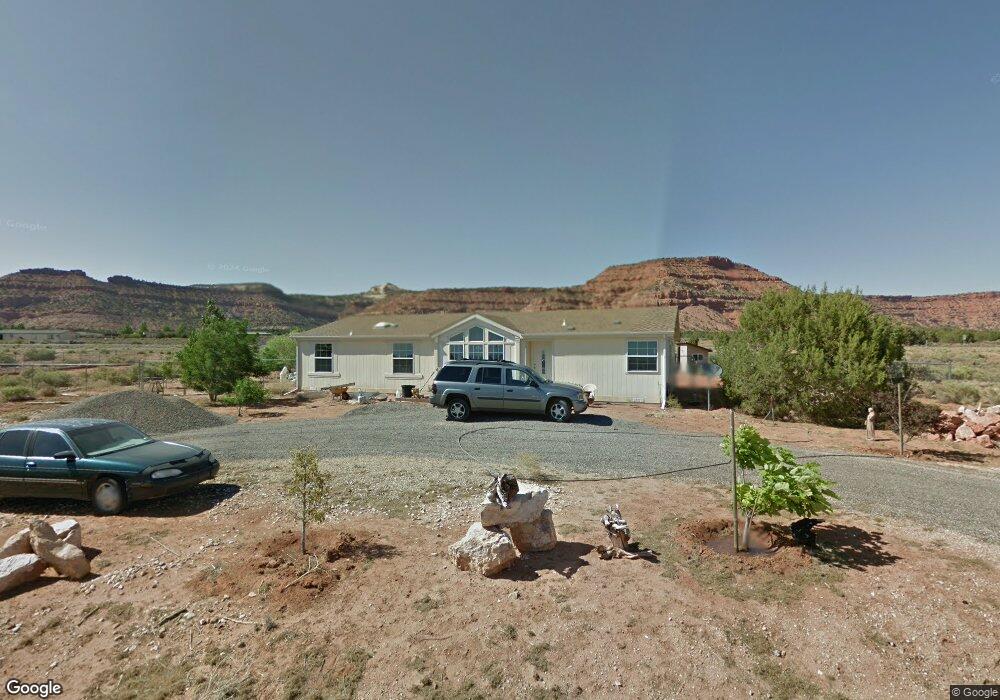
This home is located at 5155 E Boulder Bluff Blvd, Kanab, UT 84741 and is currently estimated at $396,306, approximately $206 per square foot. 5155 E Boulder Bluff Blvd is a home located in Kane County with nearby schools including Kanab Elementary School, Kanab Middle School, and Kanab High School.
Ownership History
Date
Name
Owned For
Owner Type
Purchase Details
Closed on
Nov 30, 2010
Sold by
Waters Roger
Bought by
Waters Roger and Waters Margi L
Current Estimated Value
Home Financials for this Owner
Home Financials are based on the most recent Mortgage that was taken out on this home.
Original Mortgage
$134,000
Outstanding Balance
$88,260
Interest Rate
4.16%
Estimated Equity
$308,046
Purchase Details
Closed on
Sep 25, 2007
Sold by
Waters Margi
Bought by
Waters Roger
Home Financials for this Owner
Home Financials are based on the most recent Mortgage that was taken out on this home.
Original Mortgage
$134,150
Interest Rate
6.57%
Purchase Details
Closed on
Feb 13, 2007
Sold by
Waters Roger and Waters Margi
Bought by
Kane County
Purchase Details
Closed on
Aug 1, 2005
Sold by
Kressin James R and Kressin Barbara J
Bought by
Waters Roger and Waters Margi
Create a Home Valuation Report for This Property
The Home Valuation Report is an in-depth analysis detailing your home's value as well as a comparison with similar homes in the area
Purchase History
| Date | Buyer | Sale Price | Title Company |
|---|---|---|---|
| Waters Roger | -- | -- | |
| Waters Roger | -- | -- | |
| Kane County | -- | -- | |
| Waters Roger | -- | -- |
Source: Public Records
Mortgage History
| Date | Status | Borrower | Loan Amount |
|---|---|---|---|
| Open | Waters Roger | $134,000 | |
| Previous Owner | Waters Roger | $134,150 |
Source: Public Records
Tax History
| Year | Tax Paid | Tax Assessment Tax Assessment Total Assessment is a certain percentage of the fair market value that is determined by local assessors to be the total taxable value of land and additions on the property. | Land | Improvement |
|---|---|---|---|---|
| 2025 | $1,320 | $348,907 | $119,191 | $229,716 |
| 2024 | $1,275 | $183,669 | $64,975 | $118,694 |
| 2023 | $1,039 | $159,074 | $60,162 | $98,912 |
| 2022 | $1,017 | $137,726 | $38,814 | $98,912 |
| 2021 | $1,004 | $204,152 | $54,285 | $149,867 |
| 2020 | $1,001 | $196,430 | $56,347 | $140,083 |
| 2019 | $1,029 | $196,430 | $56,347 | $140,083 |
| 2018 | $921 | $174,203 | $46,956 | $127,247 |
| 2017 | $791 | $143,316 | $36,120 | $107,196 |
| 2016 | $746 | $131,504 | $30,100 | $101,404 |
| 2015 | $750 | $137,252 | $30,100 | $107,152 |
| 2014 | $750 | $131,896 | $39,123 | $92,773 |
| 2013 | -- | $72,544 | $0 | $0 |
Source: Public Records
Map
Nearby Homes
- Lot 6 Rowel
- 5120 Grande Vermillion Ave
- Lot 10 Rowel
- Lot 7 Rowel
- Lot 11 Lone Spur
- 0 Lot 127 Vermillion Cliff Estates
- Lot 9 Rowel
- Lot 8 Rowel
- Lot 20 Lone Spur
- Lot 19 Lone Spur
- Lot 1 Boulder Bluff Blvd
- Lot 2 Boulder Bluff Blvd
- Lot 3 Boulder Bluff Blvd
- Lot 5 Boulder Bluff Blvd
- Lot 4 Boulder Bluff Blvd
- 4960 E Grand Vermillion
- 4441 Red Cliffs Dr
- 4395 E Mountain View Dr Unit C-77
- Lot 10 Silver Dawn Cir
- 6026 E Zion Rd
- 34 S Sunset Dr
- Lot 34 S Sunset Dr
- 5105 E Boulder Bluff Blvd
- 1225 S Sunset Dr
- 5171 Grande Vermillion Ave
- 5170 E Grande Vermillion Ave
- 1280 S Sunset Dr
- 5070 E Grande Vermillion Ave
- 5125 E Grande Vermillion Ave
- 1235 S Prairie Cir
- 5048 E Grande Vermillion Ave
- 1135 S Canyon Ave
- 4210 E Sunset Cir Unit 33
- 4210 E Sunset Cir
- 1250 Lone Spur Cir
- 5045 E Boulder Bluff Blvd
- 1351 S Sunset Dr
- 0 S Sunset Dr
- 1426 S Sunset Dr
- 1058 S Cliff View Ln
Your Personal Tour Guide
Ask me questions while you tour the home.