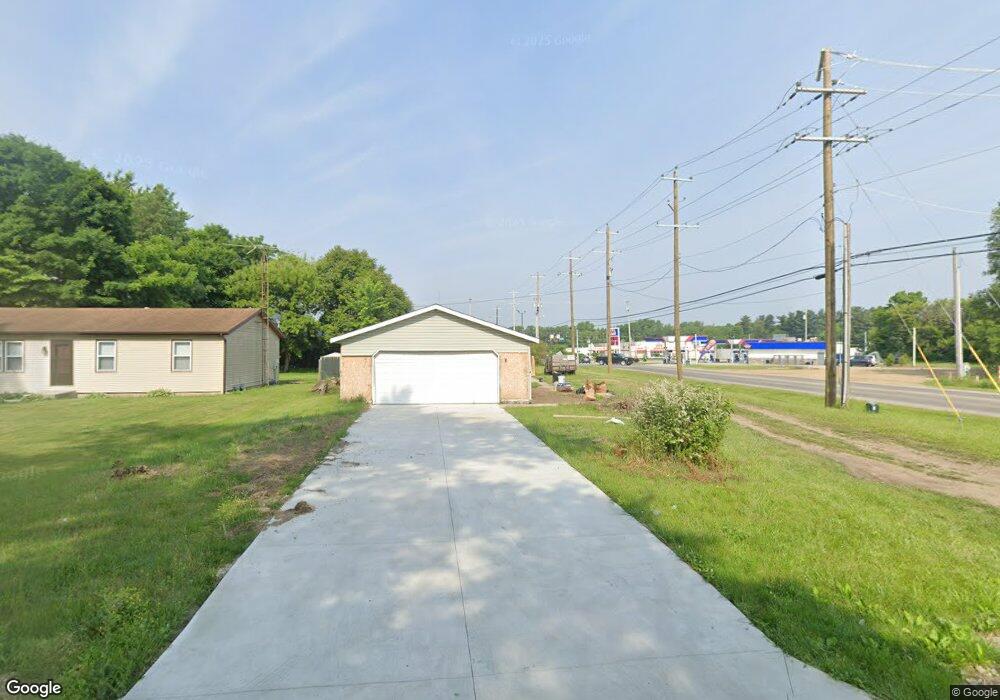
51553 Myrtle Ave South Bend, IN 46637
Estimated Value: $100,000 - $263,000
4
Beds
2
Baths
1,725
Sq Ft
$119/Sq Ft
Est. Value
About This Home
This home is located at 51553 Myrtle Ave, South Bend, IN 46637 and is currently estimated at $206,028, approximately $119 per square foot. 51553 Myrtle Ave is a home located in St. Joseph County with nearby schools including Clay Intermediate Center, Darden Elementary School, and Jefferson Intermediate Traditional School.
Ownership History
Date
Name
Owned For
Owner Type
Purchase Details
Closed on
Jul 22, 2024
Sold by
Leeper Brian D
Bought by
Tsg Source Group Llc
Current Estimated Value
Purchase Details
Closed on
Jul 19, 2024
Sold by
Leeper Brian D
Bought by
Tsg Source Group Llc
Purchase Details
Closed on
Jan 5, 2007
Sold by
Ciesiolka Ronald A and Ciesiolka Judy G
Bought by
Leeper Brian D
Home Financials for this Owner
Home Financials are based on the most recent Mortgage that was taken out on this home.
Original Mortgage
$88,416
Interest Rate
6.24%
Mortgage Type
FHA
Create a Home Valuation Report for This Property
The Home Valuation Report is an in-depth analysis detailing your home's value as well as a comparison with similar homes in the area
Purchase History
| Date | Buyer | Sale Price | Title Company |
|---|---|---|---|
| Tsg Source Group Llc | $52,000 | None Listed On Document | |
| Tsg Source Group Llc | $52,000 | None Listed On Document | |
| Leeper Brian D | -- | Metropolitan Title In Llc |
Source: Public Records
Mortgage History
| Date | Status | Borrower | Loan Amount |
|---|---|---|---|
| Previous Owner | Leeper Brian D | $88,416 |
Source: Public Records
Tax History
| Year | Tax Paid | Tax Assessment Tax Assessment Total Assessment is a certain percentage of the fair market value that is determined by local assessors to be the total taxable value of land and additions on the property. | Land | Improvement |
|---|---|---|---|---|
| 2025 | $3,993 | $263,200 | $35,700 | $227,500 |
| 2024 | $6,766 | $180,200 | $35,700 | $144,500 |
| 2023 | $3,736 | $164,300 | $35,700 | $128,600 |
| 2022 | $3,736 | $164,300 | $35,700 | $128,600 |
| 2021 | $3,365 | $138,200 | $18,200 | $120,000 |
| 2020 | $2,973 | $121,900 | $16,100 | $105,800 |
| 2019 | $2,354 | $115,300 | $15,200 | $100,100 |
| 2018 | $2,505 | $108,500 | $14,100 | $94,400 |
| 2017 | $2,562 | $105,800 | $14,100 | $91,700 |
| 2016 | $2,878 | $115,300 | $12,700 | $102,600 |
| 2014 | $2,494 | $98,900 | $10,800 | $88,100 |
Source: Public Records
Map
Nearby Homes
- 19664 Eaton Ave
- 19666 Oakdale Ave
- 51567 Prescott Ave
- 51583 Prescott Ave
- 51894 Indiana State Route 933
- 20140 Auten Rd
- 19500 Greenacre St
- 19793 Greenacre St
- 19801 Greenacre St
- 19669 Burke St
- 51675 - 51743 State Highway 933
- 52078 Forestbrook Ave
- 52128 Helmen Ave
- 19520 Palisade Ave
- 52236 Myrtle Ave
- 19343 Burke St
- 52138 Hollyhock Rd
- 19312 Haviland Dr
- 52303 Hollyhock Rd
- 18764 Auten Rd
- 51553 W Myrtle Dr
- 51557 Myrtle Ave
- 51559 Myrtle Ave
- 19664 Auten Rd
- 51561 Myrtle Ave
- 51563 Myrtle Ave
- 19638 Auten Rd
- 51586 Myrtle Ave
- 51565 Myrtle Ave
- 19626 Auten Rd Unit Just north of Notre
- 19626 Auten Rd
- 51585 Myrtle Ave
- 51597 Myrtle Ave
- 19675 Eaton Ave
- 19627 Auten Rd
- 51606 Indiana State Route 933
- 19612 Auten Rd
- 19653 Eaton Ave
- 51618 Indiana State Route 933
- 51618 U S 31
Your Personal Tour Guide
Ask me questions while you tour the home.