Estimated Value: $466,000 - $480,000
4
Beds
3
Baths
2,082
Sq Ft
$228/Sq Ft
Est. Value
About This Home
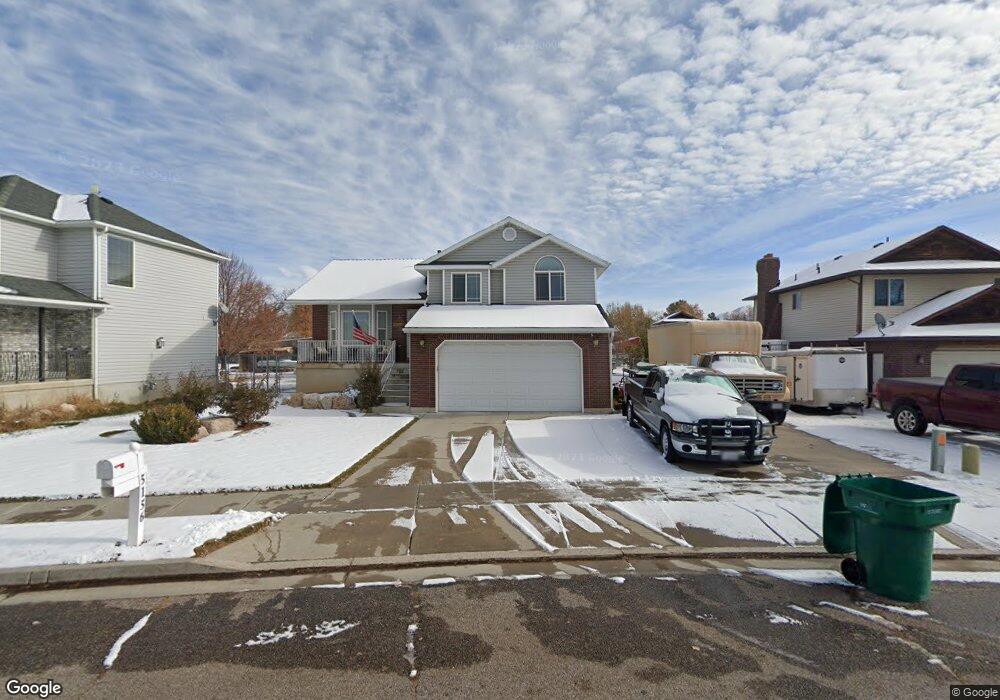
This home is located at 5156 S 3200 W, Roy, UT 84067 and is currently estimated at $474,277, approximately $227 per square foot. 5156 S 3200 W is a home located in Weber County with nearby schools including Midland School, Sand Ridge Junior High School, and Roy High School.
Ownership History
Date
Name
Owned For
Owner Type
Purchase Details
Closed on
Jun 25, 2007
Sold by
Maire Kenneth L and Maire Susan E
Bought by
Klebenow Dean T and Klebenow Cidalia F
Current Estimated Value
Home Financials for this Owner
Home Financials are based on the most recent Mortgage that was taken out on this home.
Original Mortgage
$155,600
Outstanding Balance
$95,314
Interest Rate
6.21%
Mortgage Type
Purchase Money Mortgage
Estimated Equity
$378,963
Purchase Details
Closed on
Jul 12, 2001
Sold by
Oliver Justin
Bought by
Oliver Justin Max and Taylor Jan N
Home Financials for this Owner
Home Financials are based on the most recent Mortgage that was taken out on this home.
Original Mortgage
$106,500
Interest Rate
6.37%
Purchase Details
Closed on
Apr 17, 2001
Sold by
Eborn Harold and Karras Allan
Bought by
Oliver Justin
Home Financials for this Owner
Home Financials are based on the most recent Mortgage that was taken out on this home.
Original Mortgage
$67,036
Interest Rate
7.26%
Create a Home Valuation Report for This Property
The Home Valuation Report is an in-depth analysis detailing your home's value as well as a comparison with similar homes in the area
Home Values in the Area
Average Home Value in this Area
Purchase History
| Date | Buyer | Sale Price | Title Company |
|---|---|---|---|
| Klebenow Dean T | -- | Backman | |
| Oliver Justin Max | -- | Mountain View Title | |
| Oliver Justin | -- | Mountain View Title |
Source: Public Records
Mortgage History
| Date | Status | Borrower | Loan Amount |
|---|---|---|---|
| Open | Klebenow Dean T | $155,600 | |
| Previous Owner | Oliver Justin Max | $106,500 | |
| Previous Owner | Oliver Justin | $67,036 |
Source: Public Records
Tax History Compared to Growth
Tax History
| Year | Tax Paid | Tax Assessment Tax Assessment Total Assessment is a certain percentage of the fair market value that is determined by local assessors to be the total taxable value of land and additions on the property. | Land | Improvement |
|---|---|---|---|---|
| 2025 | $265 | $458,888 | $135,000 | $323,888 |
| 2024 | $259 | $248,049 | $74,256 | $173,793 |
| 2023 | $250 | $238,700 | $65,864 | $172,836 |
| 2022 | $2,936 | $270,050 | $60,501 | $209,549 |
| 2021 | $208 | $343,000 | $79,963 | $263,037 |
| 2020 | $2,211 | $306,000 | $79,963 | $226,037 |
| 2019 | $190 | $280,000 | $44,976 | $235,024 |
| 2018 | $190 | $263,000 | $40,002 | $222,998 |
| 2017 | $190 | $225,000 | $40,002 | $184,998 |
| 2016 | $188 | $112,174 | $21,944 | $90,230 |
| 2015 | $186 | $101,449 | $21,944 | $79,505 |
| 2014 | $1,573 | $97,207 | $21,944 | $75,263 |
Source: Public Records
Map
Nearby Homes
- 5321 S 3100 W
- 5304 S 3100 W
- 5009 S 2925 W
- 3443 W 5200 S Unit 2&3
- 5173 S 2825 W
- 5063 S 2825 W
- 5003 S 2825 W
- 4891 S 2875 W
- 3509 W 4835 S Unit 26
- 3517 W 4835 S Unit 27
- 3512 W 4835 S Unit 24
- 3166 W 5625 S
- 3176 W 5625 S
- 3077 W 4650 S
- 5007 S 2675 W
- 4919 S 2675 W
- 4635 S 2950 W
- 4875 S 2675 W
- 4732 S West Park Dr
- 2581 W 5000 S
- 5142 S 3200 W
- 5172 S 3175 W
- 5180 S 3175 W
- 5114 S 3200 W
- 5179 S 3175 W
- 5188 S 3175 W
- 5155 S 3200 W
- 5155 S 3200 W Unit 17-R
- 5171 S 3175 W
- 3154 W 5200 S
- 5141 S 3200 W
- 5141 S 3200 W Unit 18
- 5098 S 3200 W
- 5187 S 3175 W
- 5127 S 3200 W
- 3187 W 5075 S
- 5194 S 3175 W
- 3136 W 5200 S
- 3181 W 5075 S
- 3181 W 5075 S Unit 9