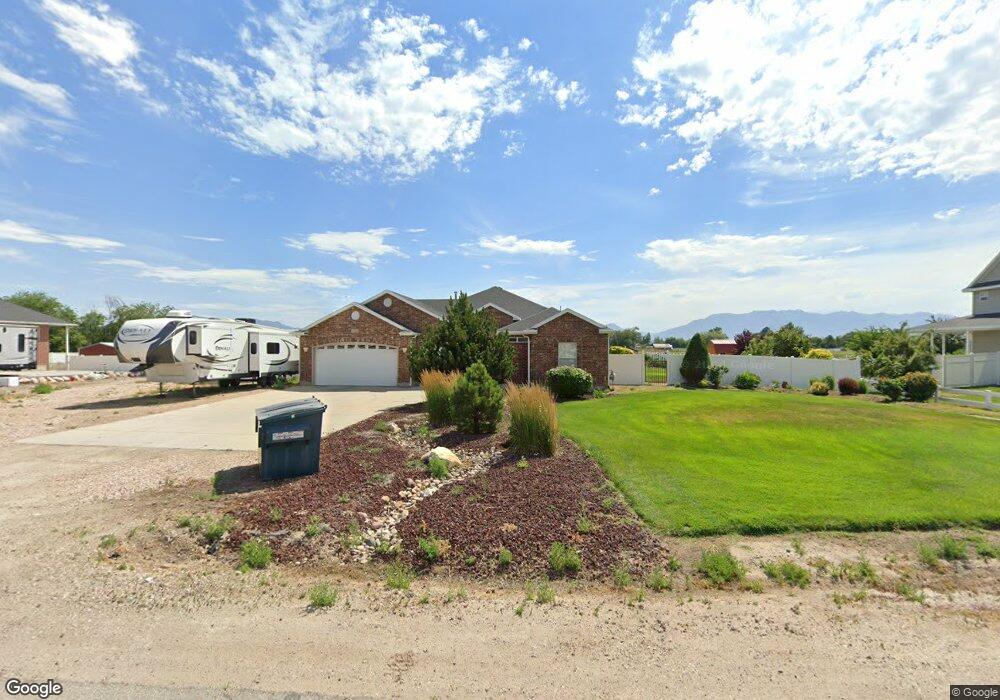
5158 S 5300 W Hooper, UT 84315
Estimated Value: $648,000 - $718,684
2
Beds
2
Baths
2,519
Sq Ft
$273/Sq Ft
Est. Value
About This Home
This home is located at 5158 S 5300 W, Hooper, UT 84315 and is currently estimated at $688,171, approximately $273 per square foot. 5158 S 5300 W is a home located in Weber County with nearby schools including Hooper Elementary School, Rocky Mountain Junior High School, and Fremont High School.
Ownership History
Date
Name
Owned For
Owner Type
Purchase Details
Closed on
Oct 23, 2018
Sold by
Jaramillo James and Jaramillo Deborah
Bought by
Jaramillo James and Jaramillo Deborah Ann
Current Estimated Value
Purchase Details
Closed on
Feb 16, 2009
Sold by
Jaramillo Wilfred O and Jaramillo James
Bought by
Jaramillo James and Jaramillo Deborah
Home Financials for this Owner
Home Financials are based on the most recent Mortgage that was taken out on this home.
Original Mortgage
$240,000
Outstanding Balance
$151,547
Interest Rate
5.08%
Mortgage Type
New Conventional
Estimated Equity
$536,624
Purchase Details
Closed on
Jan 20, 2005
Sold by
Hancock Farms Co Partnership
Bought by
Capital Assets Financial Services Inc
Purchase Details
Closed on
Apr 16, 2004
Sold by
Jaramillo James and Jaramillo Deborah A
Bought by
Jaramillo Wilfred O and Jaramillo James
Home Financials for this Owner
Home Financials are based on the most recent Mortgage that was taken out on this home.
Original Mortgage
$175,000
Interest Rate
5.57%
Mortgage Type
New Conventional
Create a Home Valuation Report for This Property
The Home Valuation Report is an in-depth analysis detailing your home's value as well as a comparison with similar homes in the area
Home Values in the Area
Average Home Value in this Area
Purchase History
| Date | Buyer | Sale Price | Title Company |
|---|---|---|---|
| Jaramillo James | -- | None Available | |
| Jaramillo James | -- | Equity Title West Jordan-Jor | |
| Capital Assets Financial Services Inc | $310,000 | Integrated Title Insurance S | |
| Jaramillo Wilfred O | -- | Founders Title | |
| Jaramillo James | -- | Founders Title |
Source: Public Records
Mortgage History
| Date | Status | Borrower | Loan Amount |
|---|---|---|---|
| Open | Jaramillo James | $240,000 | |
| Previous Owner | Jaramillo James | $175,000 |
Source: Public Records
Tax History Compared to Growth
Tax History
| Year | Tax Paid | Tax Assessment Tax Assessment Total Assessment is a certain percentage of the fair market value that is determined by local assessors to be the total taxable value of land and additions on the property. | Land | Improvement |
|---|---|---|---|---|
| 2025 | $3,300 | $670,439 | $243,367 | $427,072 |
| 2024 | $3,188 | $361,899 | $133,851 | $228,048 |
| 2023 | $3,210 | $358,600 | $131,385 | $227,215 |
| 2022 | $3,097 | $334,950 | $107,752 | $227,198 |
| 2021 | $2,738 | $507,000 | $144,760 | $362,240 |
| 2020 | $2,431 | $421,000 | $125,960 | $295,040 |
| 2019 | $2,287 | $379,000 | $116,795 | $262,205 |
| 2018 | $2,103 | $338,000 | $97,995 | $240,005 |
| 2017 | $1,969 | $310,000 | $94,000 | $216,000 |
| 2016 | $2,203 | $184,556 | $41,360 | $143,196 |
| 2015 | $2,163 | $179,288 | $42,911 | $136,377 |
| 2014 | $1,876 | $154,785 | $35,156 | $119,629 |
Source: Public Records
Map
Nearby Homes
- 4879 S 5050 W
- 5335 W 5500 S
- 5160 W 5725 S
- 4931 S 4700 W
- 3729 S 5600 W Unit 6
- 3720 S 5600 W Unit 2
- 3719 S 5600 W Unit 7
- 4700 W 5500 S
- 5947 W 4600 S
- 4556 W 4950 S
- 0 W 5500 S
- 6014 W 5300 S
- 4909 W 5850 S
- 3191 S 5100 St W Unit 1
- 4449 W 5325 S
- 4632 W 5750 S
- 4337 W 5430 S Unit A
- 6036 W 4700 S
- 5116 S 4300 W
- 4309 W 5430 St #B S
- 5158 S 5300 W Unit 15
- 5138 S 5300 W
- 5138 S 5300 W Unit 16
- 5178 S 5300 W
- 5178 S 5300 W Unit 14
- 5153 W 5100 S
- 5118 S 5300 W
- 5118 S 5300 W Unit 17
- 5173 S 5300 W
- 5173 S 5300 W Unit 13
- 5133 S 5300 W
- 5133 S 5300 W Unit 11
- 5113 S 5100 W
- 5353 W 5100 S
- 5215 W 5100 S
- 5042 S 5300 W
- 5244 W 5100 S
- 5271 W 5100 S
- 4985 S 5300 W Unit 22
- 4970 S 5300 W Unit 33