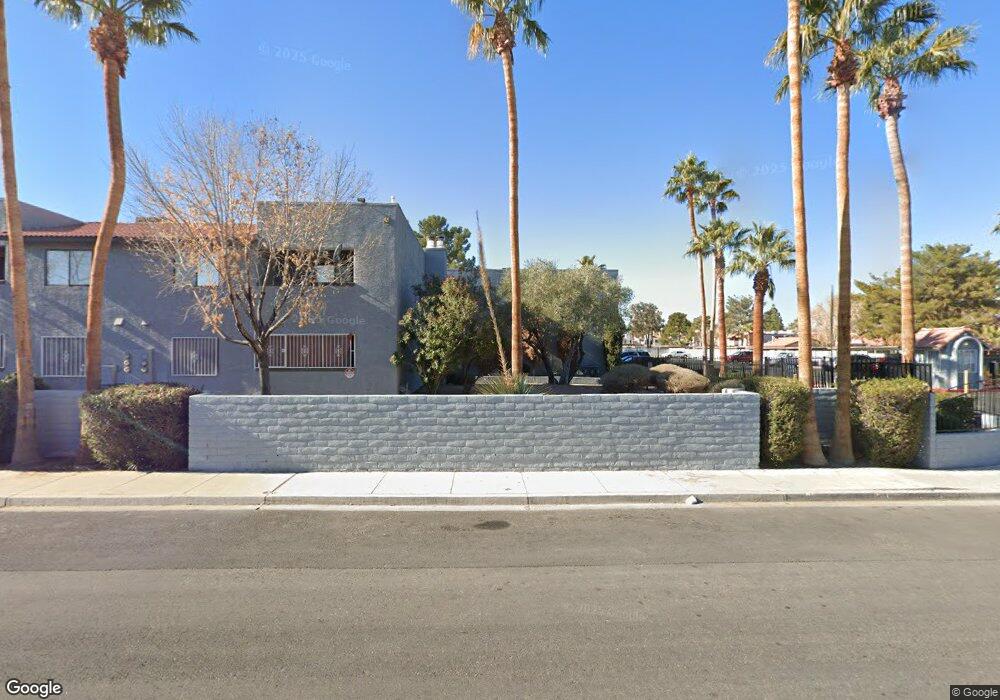
5159 Caliente St Unit 165 Las Vegas, NV 89119
University District NeighborhoodEstimated Value: $126,000 - $191,000
2
Beds
2
Baths
994
Sq Ft
$174/Sq Ft
Est. Value
About This Home
This home is located at 5159 Caliente St Unit 165, Las Vegas, NV 89119 and is currently estimated at $173,201, approximately $174 per square foot. 5159 Caliente St Unit 165 is a home located in Clark County with nearby schools including Gene Ward Elementary School, Jack Dailey Elementary School, and Helen C. Cannon Junior High School.
Ownership History
Date
Name
Owned For
Owner Type
Purchase Details
Closed on
May 19, 2004
Sold by
Taylor Evelyne L
Bought by
Mello David E and Mello Bridgit L
Current Estimated Value
Home Financials for this Owner
Home Financials are based on the most recent Mortgage that was taken out on this home.
Original Mortgage
$68,000
Outstanding Balance
$32,977
Interest Rate
5.99%
Mortgage Type
Unknown
Estimated Equity
$140,224
Purchase Details
Closed on
Aug 22, 2003
Sold by
Taylor Evelyne L and Taylor James Edward
Bought by
Taylor Evelyne L
Home Financials for this Owner
Home Financials are based on the most recent Mortgage that was taken out on this home.
Original Mortgage
$64,000
Interest Rate
5.6%
Mortgage Type
Unknown
Purchase Details
Closed on
Jan 18, 1994
Sold by
Caliente Enterprises Inc
Bought by
Taylor Evelyne L and Taylor James Edward
Home Financials for this Owner
Home Financials are based on the most recent Mortgage that was taken out on this home.
Original Mortgage
$61,200
Interest Rate
7.16%
Create a Home Valuation Report for This Property
The Home Valuation Report is an in-depth analysis detailing your home's value as well as a comparison with similar homes in the area
Home Values in the Area
Average Home Value in this Area
Purchase History
| Date | Buyer | Sale Price | Title Company |
|---|---|---|---|
| Mello David E | $85,000 | United Title Of Nevada | |
| Taylor Evelyne L | -- | Ticor Title Of Nevada Inc | |
| Taylor Evelyne L | $68,000 | Old Republic Title Co |
Source: Public Records
Mortgage History
| Date | Status | Borrower | Loan Amount |
|---|---|---|---|
| Open | Mello David E | $68,000 | |
| Previous Owner | Taylor Evelyne L | $64,000 | |
| Previous Owner | Taylor Evelyne L | $61,200 |
Source: Public Records
Tax History Compared to Growth
Tax History
| Year | Tax Paid | Tax Assessment Tax Assessment Total Assessment is a certain percentage of the fair market value that is determined by local assessors to be the total taxable value of land and additions on the property. | Land | Improvement |
|---|---|---|---|---|
| 2025 | $535 | $32,314 | $16,450 | $15,864 |
| 2024 | $496 | $32,314 | $16,450 | $15,864 |
| 2023 | $496 | $33,208 | $18,200 | $15,008 |
| 2022 | $460 | $30,173 | $16,100 | $14,073 |
| 2021 | $426 | $25,693 | $11,900 | $13,793 |
| 2020 | $393 | $24,040 | $10,150 | $13,890 |
| 2019 | $368 | $21,318 | $7,350 | $13,968 |
| 2018 | $351 | $19,026 | $5,250 | $13,776 |
| 2017 | $561 | $19,137 | $4,900 | $14,237 |
| 2016 | $330 | $17,995 | $3,850 | $14,145 |
| 2015 | $328 | $15,123 | $3,500 | $11,623 |
| 2014 | $318 | $10,511 | $3,500 | $7,011 |
Source: Public Records
Map
Nearby Homes
- 5219 Caliente St Unit 11
- 1751 E Reno Ave Unit 206
- 1751 E Reno Ave Unit 217
- 1751 E Reno Ave Unit 128
- 1688 Mapleton Ln
- 1655 E Hacienda Ave
- 5343 Tamarus St
- 5049 Spencer St Unit D
- 1673 Caliente Ct
- 5260 Dickens Dr
- 1375 E Hacienda Ave Unit 201
- 5272 Dickens Dr
- 5078 Spencer St Unit D
- 5064 Spencer St Unit B
- 5015 Spencer St Unit C
- 5403 Tamarus St
- 5368 Escondido St
- 5060 Newport Cove Dr Unit B
- 5060 Newport Cove Dr Unit C
- 5445 Caliente St
- 5159 Caliente St Unit 162
- 5159 Caliente St Unit 163
- 5159 Caliente St Unit 161
- 5159 Caliente St Unit 164
- 5159 Caliente St Unit 166
- 5163 Caliente St Unit 152
- 5163 Caliente St Unit 154
- 5163 Caliente St Unit 151
- 5163 Caliente St Unit 153
- 5155 Caliente St Unit 172
- 5155 Caliente St Unit 174
- 5155 Caliente St Unit 176
- 5155 Caliente St Unit 171
- 5155 Caliente St Unit 175
- 5155 Caliente St Unit 173
- 5167 Caliente St Unit 141
- 5167 Caliente St Unit 144
- 5167 Caliente St Unit 146
- 5167 Caliente St Unit 143
- 5167 Caliente St Unit 142