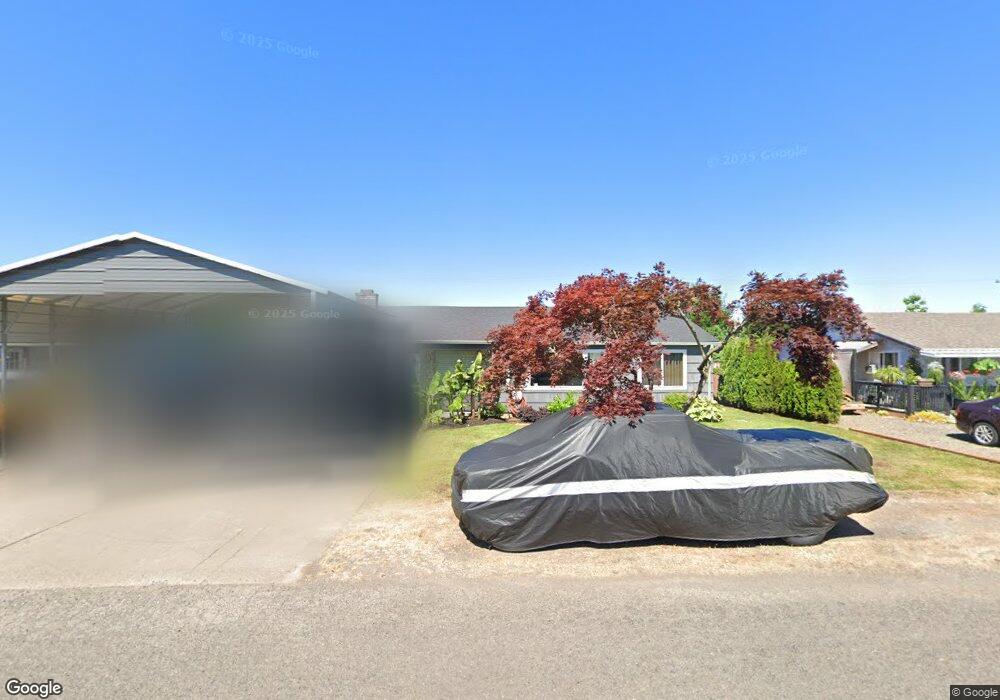
516 32nd St Springfield, OR 97478
East Springfield NeighborhoodEstimated Value: $298,000 - $379,826
3
Beds
1
Bath
1,546
Sq Ft
$228/Sq Ft
Est. Value
About This Home
This home is located at 516 32nd St, Springfield, OR 97478 and is currently estimated at $352,207, approximately $227 per square foot. 516 32nd St is a home located in Lane County with nearby schools including Riverbend Elementary School, Briggs Middle School, and Thurston High School.
Ownership History
Date
Name
Owned For
Owner Type
Purchase Details
Closed on
Dec 16, 2020
Sold by
Koanui Jaclyn S
Bought by
Koanui Thomas A and Koanui Jaclyn S
Current Estimated Value
Home Financials for this Owner
Home Financials are based on the most recent Mortgage that was taken out on this home.
Original Mortgage
$165,000
Outstanding Balance
$119,434
Interest Rate
2.9%
Mortgage Type
New Conventional
Estimated Equity
$232,773
Purchase Details
Closed on
Jun 20, 2017
Sold by
Robertson Jaclyn S and Koanui Jaclyn S
Bought by
Koanui Jaclyn S
Purchase Details
Closed on
Sep 27, 2002
Sold by
Martin James and Martin James D
Bought by
Robertson Jaclyn S
Home Financials for this Owner
Home Financials are based on the most recent Mortgage that was taken out on this home.
Original Mortgage
$100,750
Interest Rate
6.17%
Create a Home Valuation Report for This Property
The Home Valuation Report is an in-depth analysis detailing your home's value as well as a comparison with similar homes in the area
Home Values in the Area
Average Home Value in this Area
Purchase History
We collect this data history from publicly available records. To have your information removed, we recommend requesting removal directly through your county’s website.
| Date | Buyer | Sale Price | Title Company |
|---|---|---|---|
| Koanui Thomas A | -- | None Available | |
| Koanui Jaclyn S | -- | None Available | |
| Robertson Jaclyn S | $110,000 | Western Title & Escrow Compa |
Source: Public Records
Mortgage History
We collect this data history from publicly available records. To have your information removed, we recommend requesting removal directly through your county’s website.
| Date | Status | Borrower | Loan Amount |
|---|---|---|---|
| Open | Koanui Thomas A | $165,000 | |
| Closed | Robertson Jaclyn S | $100,750 |
Source: Public Records
Tax History
| Year | Tax Paid | Tax Assessment Tax Assessment Total Assessment is a certain percentage of the fair market value that is determined by local assessors to be the total taxable value of land and additions on the property. | Land | Improvement |
|---|---|---|---|---|
| 2025 | $3,223 | $175,746 | -- | -- |
| 2024 | $3,171 | $170,628 | -- | -- |
| 2023 | $3,171 | $165,659 | -- | -- |
| 2022 | $2,936 | $160,834 | $0 | $0 |
| 2021 | $2,884 | $156,150 | $0 | $0 |
| 2020 | $2,800 | $151,602 | $0 | $0 |
| 2019 | $2,715 | $147,187 | $0 | $0 |
| 2018 | $2,560 | $138,738 | $0 | $0 |
| 2017 | $2,461 | $138,738 | $0 | $0 |
| 2016 | $2,410 | $134,697 | $0 | $0 |
| 2015 | $2,341 | $130,774 | $0 | $0 |
| 2014 | $2,306 | $126,965 | $0 | $0 |
Source: Public Records
Map
Nearby Homes
Your Personal Tour Guide
Ask me questions while you tour the home.