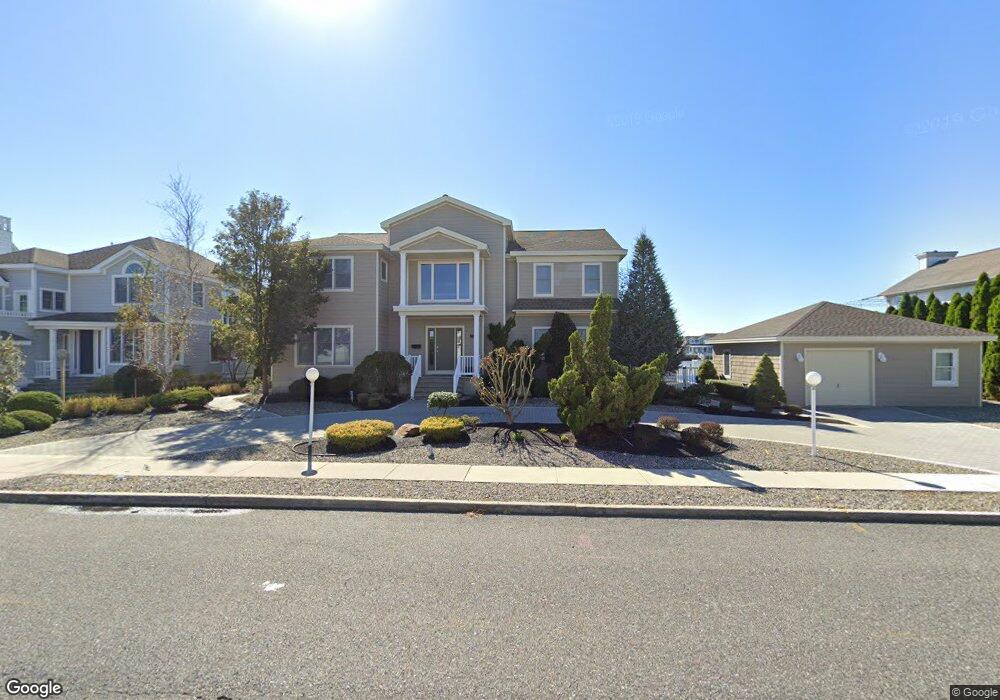
516 42nd St Avalon, NJ 08202
Estimated Value: $4,225,000 - $7,789,000
--
Bed
--
Bath
4,497
Sq Ft
$1,433/Sq Ft
Est. Value
About This Home
This home is located at 516 42nd St, Avalon, NJ 08202 and is currently estimated at $6,444,242, approximately $1,433 per square foot. 516 42nd St is a home located in Cape May County with nearby schools including Avalon Elementary School.
Ownership History
Date
Name
Owned For
Owner Type
Purchase Details
Closed on
Dec 20, 2021
Sold by
Ellis Stanley M
Bought by
Stanley M Ellis Ft
Current Estimated Value
Purchase Details
Closed on
Apr 15, 2019
Sold by
Ellis Wesley C
Bought by
Ellis Stanley M
Purchase Details
Closed on
Jan 5, 2000
Sold by
Guilday Ward
Bought by
Ellis Shirley C
Purchase Details
Closed on
Jun 10, 1991
Sold by
Nj Dep
Bought by
Lutz John W
Create a Home Valuation Report for This Property
The Home Valuation Report is an in-depth analysis detailing your home's value as well as a comparison with similar homes in the area
Home Values in the Area
Average Home Value in this Area
Purchase History
| Date | Buyer | Sale Price | Title Company |
|---|---|---|---|
| Stanley M Ellis Ft | -- | None Available | |
| Ellis Stanley M | $1,700,000 | Turnkey Title Llc | |
| Ellis Stanley M | -- | Turnkey Title Llc | |
| Ellis Shirley C | $1,700,000 | -- | |
| Lutz John W | $78,400 | -- |
Source: Public Records
Tax History Compared to Growth
Tax History
| Year | Tax Paid | Tax Assessment Tax Assessment Total Assessment is a certain percentage of the fair market value that is determined by local assessors to be the total taxable value of land and additions on the property. | Land | Improvement |
|---|---|---|---|---|
| 2025 | $26,633 | $4,337,700 | $3,210,000 | $1,127,700 |
| 2024 | $26,633 | $4,337,700 | $3,210,000 | $1,127,700 |
| 2023 | $26,417 | $4,337,700 | $3,210,000 | $1,127,700 |
| 2022 | $24,638 | $4,337,700 | $3,210,000 | $1,127,700 |
| 2021 | $23,727 | $4,337,700 | $3,210,000 | $1,127,700 |
| 2020 | $22,816 | $4,337,700 | $3,210,000 | $1,127,700 |
| 2019 | $22,122 | $4,337,700 | $3,210,000 | $1,127,700 |
| 2018 | $21,168 | $4,337,700 | $3,210,000 | $1,127,700 |
| 2017 | $17,622 | $3,169,400 | $2,137,500 | $1,031,900 |
| 2016 | $17,432 | $3,169,400 | $2,137,500 | $1,031,900 |
| 2015 | $17,146 | $3,169,400 | $2,137,500 | $1,031,900 |
| 2014 | $16,956 | $3,169,400 | $2,137,500 | $1,031,900 |
Source: Public Records
Map
Nearby Homes