Estimated Value: $130,000 - $135,877
3
Beds
1
Bath
1,087
Sq Ft
$122/Sq Ft
Est. Value
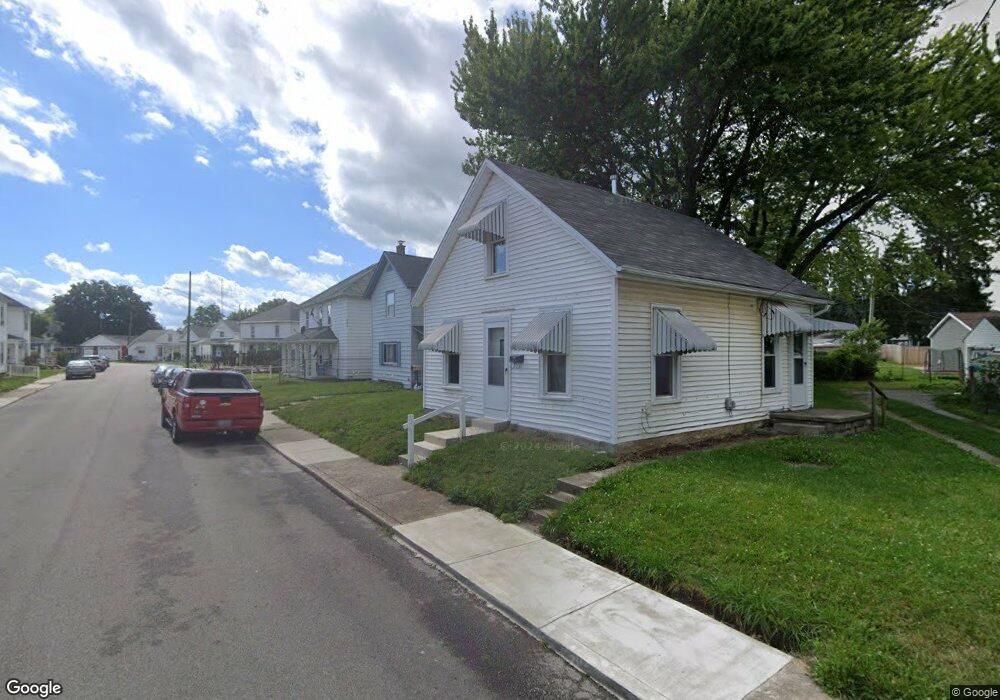
About This Home
This home is located at 516 Ann St, Piqua, OH 45356 and is currently estimated at $132,719, approximately $122 per square foot. 516 Ann St is a home located in Miami County with nearby schools including Piqua Central Intermediate School, Springcreek Primary School, and Piqua Junior High School.
Ownership History
Date
Name
Owned For
Owner Type
Purchase Details
Closed on
Apr 10, 2017
Sold by
Mcnutt Timothy B and Mcnutt Kendra
Bought by
Mcnutt Timothy B and Mcnutt Kendra
Current Estimated Value
Home Financials for this Owner
Home Financials are based on the most recent Mortgage that was taken out on this home.
Original Mortgage
$59,200
Outstanding Balance
$49,263
Interest Rate
4.21%
Mortgage Type
Future Advance Clause Open End Mortgage
Estimated Equity
$83,456
Purchase Details
Closed on
Dec 28, 2005
Sold by
Edge Robert K and Edge Fay V
Bought by
Mcnutt Timothy B
Home Financials for this Owner
Home Financials are based on the most recent Mortgage that was taken out on this home.
Original Mortgage
$66,949
Interest Rate
6.48%
Mortgage Type
FHA
Purchase Details
Closed on
Jul 19, 1989
Bought by
Edge Robert K
Create a Home Valuation Report for This Property
The Home Valuation Report is an in-depth analysis detailing your home's value as well as a comparison with similar homes in the area
Home Values in the Area
Average Home Value in this Area
Purchase History
| Date | Buyer | Sale Price | Title Company |
|---|---|---|---|
| Mcnutt Timothy B | -- | None Available | |
| Mcnutt Timothy B | $68,000 | -- | |
| Edge Robert K | $25,000 | -- |
Source: Public Records
Mortgage History
| Date | Status | Borrower | Loan Amount |
|---|---|---|---|
| Open | Mcnutt Timothy B | $59,200 | |
| Closed | Mcnutt Timothy B | $66,949 |
Source: Public Records
Tax History Compared to Growth
Tax History
| Year | Tax Paid | Tax Assessment Tax Assessment Total Assessment is a certain percentage of the fair market value that is determined by local assessors to be the total taxable value of land and additions on the property. | Land | Improvement |
|---|---|---|---|---|
| 2024 | $1,179 | $28,700 | $10,010 | $18,690 |
| 2023 | $1,179 | $28,700 | $10,010 | $18,690 |
| 2022 | $1,200 | $28,700 | $10,010 | $18,690 |
| 2021 | $1,010 | $22,090 | $7,700 | $14,390 |
| 2020 | $990 | $22,090 | $7,700 | $14,390 |
| 2019 | $995 | $22,090 | $7,700 | $14,390 |
| 2018 | $902 | $19,120 | $8,020 | $11,100 |
| 2017 | $913 | $19,120 | $8,020 | $11,100 |
| 2016 | $903 | $19,120 | $8,020 | $11,100 |
| 2015 | $888 | $18,380 | $7,700 | $10,680 |
| 2014 | $888 | $18,380 | $7,700 | $10,680 |
| 2013 | $891 | $18,380 | $7,700 | $10,680 |
Source: Public Records
Map
Nearby Homes