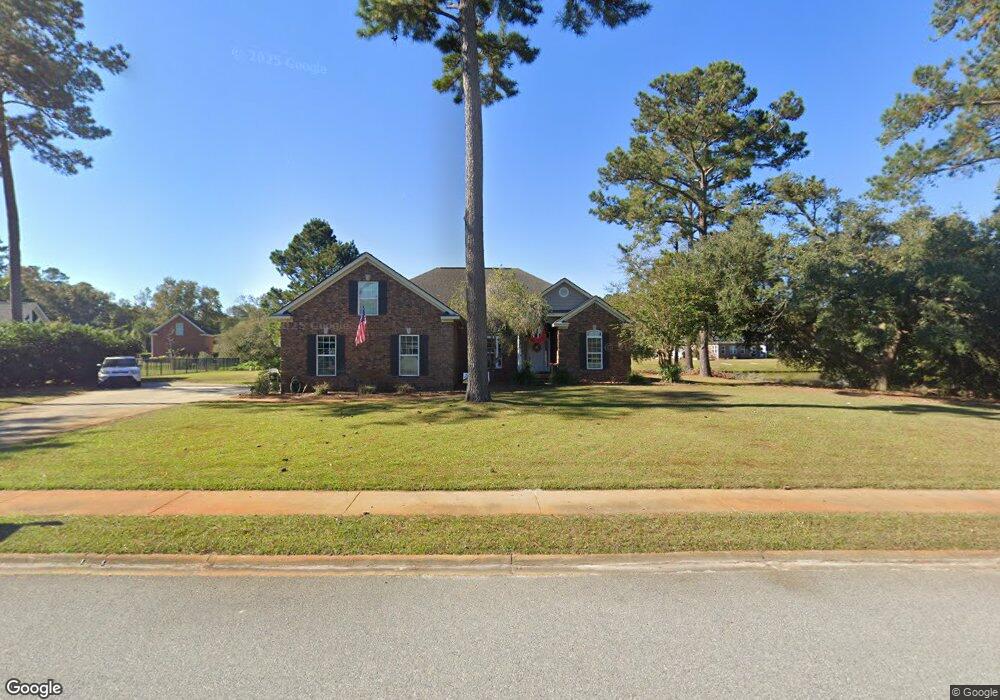
516 Brigham Dr Richmond Hill, GA 31324
Estimated Value: $486,000 - $570,000
4
Beds
3
Baths
2,382
Sq Ft
$216/Sq Ft
Est. Value
About This Home
This home is located at 516 Brigham Dr, Richmond Hill, GA 31324 and is currently estimated at $513,484, approximately $215 per square foot. 516 Brigham Dr is a home located in Bryan County with nearby schools including Frances Meeks Elementary School, Dr. George Washington Carver Elementary School, and Richmond Hill Elementary School.
Ownership History
Date
Name
Owned For
Owner Type
Purchase Details
Closed on
Jan 20, 2011
Sold by
Mclaughlin Christopher
Bought by
Morrow Durban Raymond and Morrow Jacqueline M
Current Estimated Value
Home Financials for this Owner
Home Financials are based on the most recent Mortgage that was taken out on this home.
Original Mortgage
$263,155
Outstanding Balance
$179,153
Interest Rate
4.75%
Mortgage Type
FHA
Estimated Equity
$334,331
Purchase Details
Closed on
Oct 30, 2006
Sold by
Jch Homes Llc
Bought by
Mclaughlin Elaine and Mclaughlin Christopher
Home Financials for this Owner
Home Financials are based on the most recent Mortgage that was taken out on this home.
Original Mortgage
$220,000
Interest Rate
6.27%
Mortgage Type
New Conventional
Purchase Details
Closed on
Jul 1, 2005
Sold by
Tivoli Properties Llc
Bought by
Jch Homes Llc
Create a Home Valuation Report for This Property
The Home Valuation Report is an in-depth analysis detailing your home's value as well as a comparison with similar homes in the area
Home Values in the Area
Average Home Value in this Area
Purchase History
| Date | Buyer | Sale Price | Title Company |
|---|---|---|---|
| Morrow Durban Raymond | $270,000 | -- | |
| Mclaughlin Elaine | $320,000 | -- | |
| Jch Homes Llc | $55,000 | -- |
Source: Public Records
Mortgage History
| Date | Status | Borrower | Loan Amount |
|---|---|---|---|
| Open | Morrow Durban Raymond | $263,155 | |
| Previous Owner | Mclaughlin Elaine | $220,000 |
Source: Public Records
Tax History Compared to Growth
Tax History
| Year | Tax Paid | Tax Assessment Tax Assessment Total Assessment is a certain percentage of the fair market value that is determined by local assessors to be the total taxable value of land and additions on the property. | Land | Improvement |
|---|---|---|---|---|
| 2024 | $4,099 | $161,160 | $32,000 | $129,160 |
| 2023 | $4,068 | $143,520 | $32,000 | $111,520 |
| 2022 | $3,787 | $141,400 | $32,000 | $109,400 |
| 2021 | $3,445 | $123,920 | $32,000 | $91,920 |
| 2020 | $2,976 | $119,560 | $32,000 | $87,560 |
| 2019 | $3,300 | $115,360 | $28,000 | $87,360 |
| 2018 | $3,259 | $115,360 | $28,000 | $87,360 |
| 2017 | $3,003 | $110,960 | $26,400 | $84,560 |
| 2016 | $2,935 | $106,960 | $24,000 | $82,960 |
| 2015 | $2,903 | $105,240 | $24,000 | $81,240 |
| 2014 | $2,930 | $106,120 | $24,000 | $82,120 |
Source: Public Records
Map
Nearby Homes
- 558 Brigham Dr
- 558 Brigham Dr Unit n/a
- 515 Brigham Dr
- 618 Brigham Dr
- 478 Brigham Dr
- 535 Brigham Dr
- 553 Brigham Dr
- 692 Brigham Dr
- 595 Brigham Dr
- 571 Brigham Dr
- 613 Brigham Dr
- 716 Brigham Dr
- 635 Brigham Dr
- 19584 Ga Highway 144
- 416 Brigham Dr
- 713 Brigham Dr
- 754 Brigham Dr
- 743 Brigham Dr
- 23 Brigham Ln
- 19418 Ga Highway 144