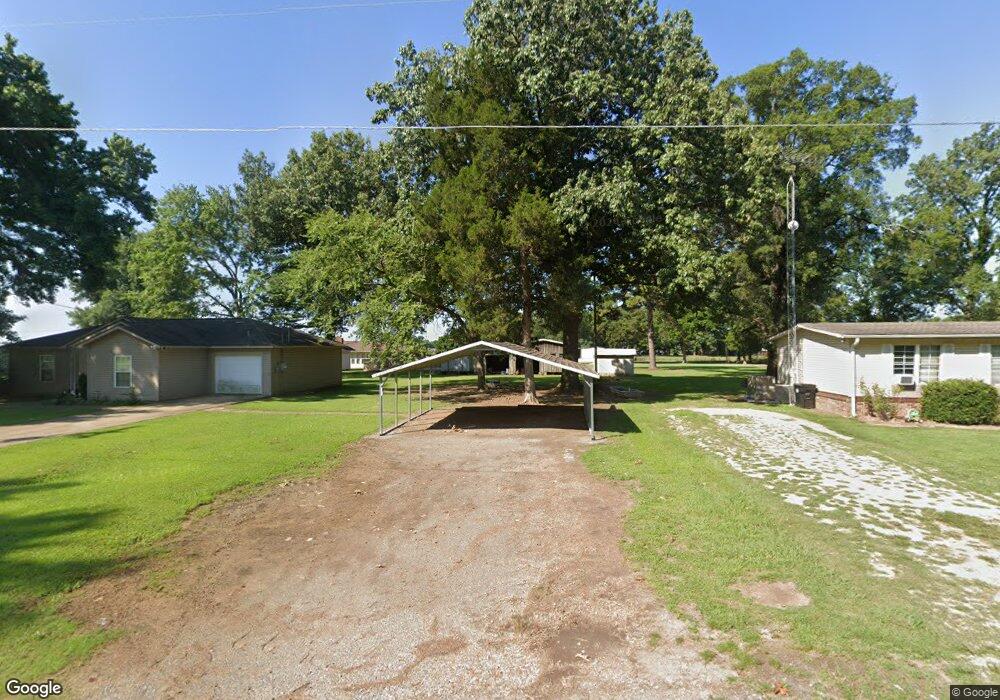
516 Broadway Marianna, AR 72360
Estimated Value: $86,045 - $136,000
--
Bed
--
Bath
1,239
Sq Ft
$89/Sq Ft
Est. Value
About This Home
This home is located at 516 Broadway, Marianna, AR 72360 and is currently estimated at $110,011, approximately $88 per square foot. 516 Broadway is a home with nearby schools including Anna Strong Intermediate School and Lee High School.
Ownership History
Date
Name
Owned For
Owner Type
Purchase Details
Closed on
Jun 1, 1993
Bought by
R#90475 Cor #136
Current Estimated Value
Create a Home Valuation Report for This Property
The Home Valuation Report is an in-depth analysis detailing your home's value as well as a comparison with similar homes in the area
Home Values in the Area
Average Home Value in this Area
Purchase History
| Date | Buyer | Sale Price | Title Company |
|---|---|---|---|
| R#90475 Cor #136 | -- | -- |
Source: Public Records
Tax History Compared to Growth
Tax History
| Year | Tax Paid | Tax Assessment Tax Assessment Total Assessment is a certain percentage of the fair market value that is determined by local assessors to be the total taxable value of land and additions on the property. | Land | Improvement |
|---|---|---|---|---|
| 2025 | $510 | $13,493 | $300 | $13,193 |
| 2024 | $451 | $11,650 | $300 | $11,350 |
| 2023 | $61 | $11,650 | $300 | $11,350 |
| 2022 | $111 | $11,650 | $300 | $11,350 |
| 2021 | $111 | $11,650 | $300 | $11,350 |
| 2020 | $111 | $11,650 | $300 | $11,350 |
| 2019 | $111 | $11,650 | $300 | $11,350 |
| 2018 | $173 | $12,540 | $300 | $12,240 |
| 2017 | $173 | $12,540 | $300 | $12,240 |
| 2016 | -- | $12,540 | $300 | $12,240 |
| 2015 | -- | $12,540 | $300 | $12,240 |
| 2014 | -- | $12,540 | $300 | $12,240 |
| 2013 | -- | $12,540 | $300 | $12,240 |
Source: Public Records
Map
Nearby Homes
- 0 Lee Road 116
- LEE 157 Other
- 000 Phillips County 115
- 2562 Highway 1 S
- 22 2n-3e
- 300 Longley Ln
- 253 Bryants Ln
- 340 Olive St
- 155 W Chestnut St
- 215 Rodgers St
- 56 E Mississippi St
- 387 Pearl St
- 559 Lee 439
- 2250 Ar- 243 Rd
- 483 Phillips 131 Rd
- 0 Arkansas 261
- 302 Doc Brown St
- 212 N Pine St
- 747 Lee 250
- 208 Doc Brown St