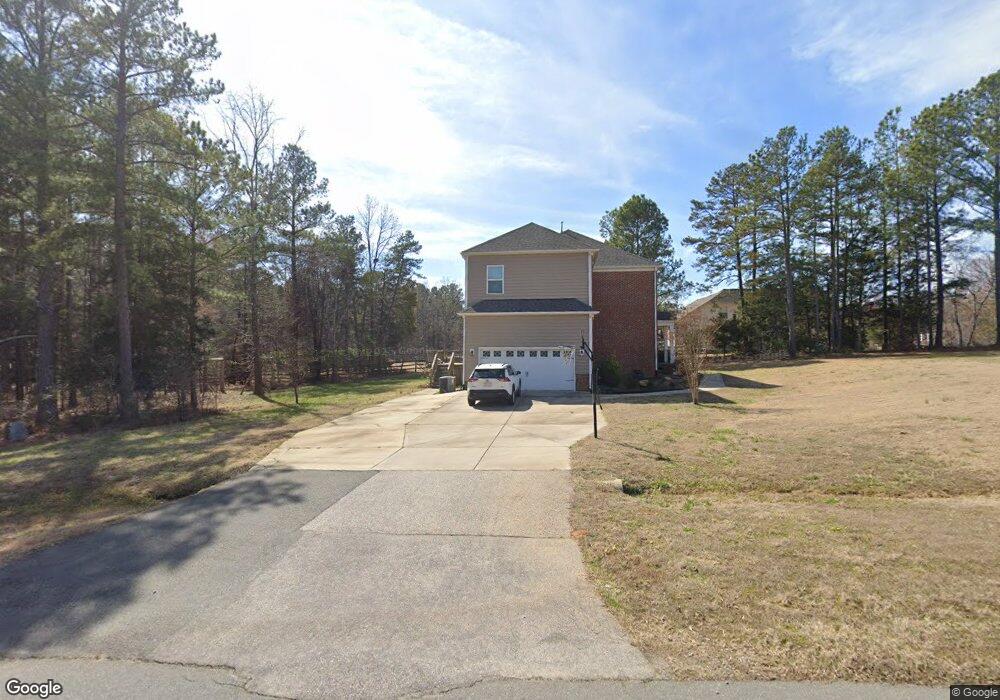
516 Copley Dr Unit 19 Rock Hill, SC 29732
Estimated Value: $508,712 - $557,000
3
Beds
3
Baths
2,450
Sq Ft
$217/Sq Ft
Est. Value
About This Home
This home is located at 516 Copley Dr Unit 19, Rock Hill, SC 29732 and is currently estimated at $532,428, approximately $217 per square foot. 516 Copley Dr Unit 19 is a home located in York County with nearby schools including Saluda Trail Middle School, South Pointe High School, and York Preparatory Academy.
Ownership History
Date
Name
Owned For
Owner Type
Purchase Details
Closed on
Sep 18, 2019
Sold by
Massey Jonathan Paul and Massey Bobbie Jean
Bought by
Pittman Scott Spencer
Current Estimated Value
Home Financials for this Owner
Home Financials are based on the most recent Mortgage that was taken out on this home.
Original Mortgage
$220,000
Outstanding Balance
$192,703
Interest Rate
3.6%
Mortgage Type
New Conventional
Estimated Equity
$339,725
Purchase Details
Closed on
Feb 17, 2016
Sold by
Live Well Homes Llc
Bought by
Massey Jonathan Paul and Massey Bobbie Jean
Home Financials for this Owner
Home Financials are based on the most recent Mortgage that was taken out on this home.
Original Mortgage
$262,447
Interest Rate
3.81%
Mortgage Type
FHA
Purchase Details
Closed on
Aug 10, 2015
Sold by
Har-Lee Llc
Bought by
Live Well Homes Llc
Purchase Details
Closed on
Aug 10, 2010
Sold by
Masterpiece Llc
Bought by
Har Lee Llc
Create a Home Valuation Report for This Property
The Home Valuation Report is an in-depth analysis detailing your home's value as well as a comparison with similar homes in the area
Home Values in the Area
Average Home Value in this Area
Purchase History
| Date | Buyer | Sale Price | Title Company |
|---|---|---|---|
| Pittman Scott Spencer | $315,000 | None Available | |
| Massey Jonathan Paul | $267,290 | -- | |
| Live Well Homes Llc | $42,000 | -- | |
| Har Lee Llc | $560,000 | -- |
Source: Public Records
Mortgage History
| Date | Status | Borrower | Loan Amount |
|---|---|---|---|
| Open | Pittman Scott Spencer | $220,000 | |
| Previous Owner | Massey Jonathan Paul | $262,447 |
Source: Public Records
Tax History Compared to Growth
Tax History
| Year | Tax Paid | Tax Assessment Tax Assessment Total Assessment is a certain percentage of the fair market value that is determined by local assessors to be the total taxable value of land and additions on the property. | Land | Improvement |
|---|---|---|---|---|
| 2024 | $1,718 | $12,144 | $1,800 | $10,344 |
| 2023 | $1,762 | $12,144 | $1,800 | $10,344 |
| 2022 | $1,762 | $12,144 | $1,800 | $10,344 |
| 2021 | -- | $12,144 | $1,800 | $10,344 |
| 2020 | $1,756 | $12,144 | $0 | $0 |
| 2019 | $1,565 | $12,040 | $0 | $0 |
| 2018 | $1,555 | $10,320 | $0 | $0 |
| 2017 | $1,466 | $10,320 | $0 | $0 |
| 2016 | $857 | $15,480 | $0 | $0 |
| 2014 | $274 | $2,700 | $2,700 | $0 |
| 2013 | $274 | $2,910 | $2,910 | $0 |
Source: Public Records
Map
Nearby Homes
- 2312 Joseph Ct
- 2025 Somerdale Rd
- 2173 Ridgecrest Rd
- 268 Hillsborough Ln
- 277 Hillsborough Ln
- 1217 Maddy Ln
- 1249 Maddy Ln
- 609 Rosemore Place
- Lancaster Plan at Stoneridge Hills
- Anderson Plan at Stoneridge Hills
- Sumter Plan at Stoneridge Hills
- Berkeley Plan at Stoneridge Hills
- Richland Plan at Stoneridge Hills
- Williamsburg Plan at Stoneridge Hills
- 1611 Herndon Farm Rd
- 1768 Williamsburg Dr
- 1567 Fayrene Rd
- 1826 Landry Ln
- 1939 Hendricks St
- 1925 Hendricks St
- 454 Shelby Ann Ln
- 516 Copley Dr
- 448 Shelby Ann Ln
- 453 Shelby Ann Ln Unit Lot33
- 454 Copley Unit Lot19
- 517 Copley Dr
- 442 Shelby Ann Ln Unit 17
- 442 Shelby Ann Ln
- 436 Shelby Ann Ln Unit 16
- 470 Shelby Ann Ln
- 447 Shelby Ann Ln
- 528 Copley Dr
- 529 Copley Dr
- 463 Shelby Ann Ln Unit Lot32
- 506 Copley Dr Unit 33
- 506 Copley Dr
- 471 Shelby Ann Ln
- 441 Shelby Ann Ln Unit Lot35
- 441 Shelby Ann Ln
- 523 Copley Dr