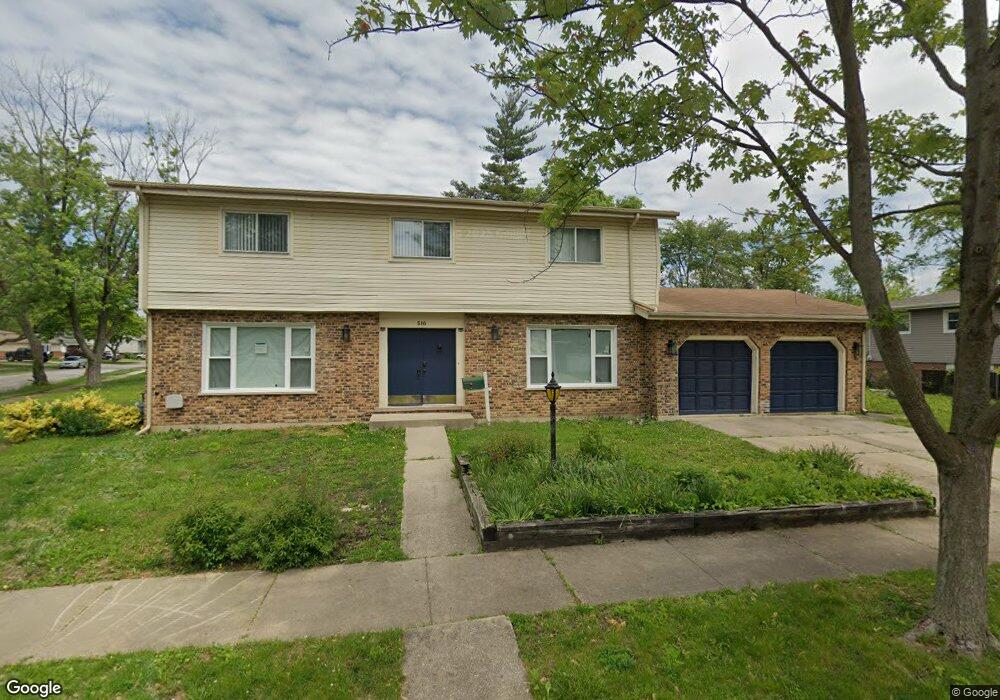
516 Davis St Unit 1 Park Forest, IL 60466
Estimated Value: $214,000 - $268,000
4
Beds
3
Baths
9,490
Sq Ft
$25/Sq Ft
Est. Value
About This Home
This home is located at 516 Davis St Unit 1, Park Forest, IL 60466 and is currently estimated at $240,817, approximately $25 per square foot. 516 Davis St Unit 1 is a home located in Cook County with nearby schools including Illinois School, Indiana Elementary School, and Arcadia Elementary School.
Ownership History
Date
Name
Owned For
Owner Type
Purchase Details
Closed on
Dec 4, 2023
Sold by
Us Bank National Association
Bought by
Its All Good Properties Llc
Current Estimated Value
Home Financials for this Owner
Home Financials are based on the most recent Mortgage that was taken out on this home.
Original Mortgage
$143,487
Outstanding Balance
$140,975
Interest Rate
7.22%
Mortgage Type
FHA
Estimated Equity
$99,843
Purchase Details
Closed on
Jul 31, 2023
Sold by
Judicial Sales Corporation
Bought by
Us Bank National Association
Purchase Details
Closed on
Feb 26, 2007
Sold by
Peterman Frederick W and Peterman Veta J
Bought by
Shelton Michelle
Home Financials for this Owner
Home Financials are based on the most recent Mortgage that was taken out on this home.
Original Mortgage
$180,000
Interest Rate
8.72%
Mortgage Type
Unknown
Purchase Details
Closed on
Feb 13, 2003
Sold by
Peterman Frederick W and Peterman Veta J
Bought by
Peterman Frederick W and Peterman Veta J
Create a Home Valuation Report for This Property
The Home Valuation Report is an in-depth analysis detailing your home's value as well as a comparison with similar homes in the area
Home Values in the Area
Average Home Value in this Area
Purchase History
| Date | Buyer | Sale Price | Title Company |
|---|---|---|---|
| Its All Good Properties Llc | $125,000 | Fidelity National Title | |
| Us Bank National Association | -- | None Listed On Document | |
| Shelton Michelle | $180,000 | Multiple | |
| Peterman Frederick W | -- | -- | |
| Peterman Frederick W | -- | -- |
Source: Public Records
Mortgage History
| Date | Status | Borrower | Loan Amount |
|---|---|---|---|
| Open | Its All Good Properties Llc | $143,487 | |
| Previous Owner | Shelton Michelle | $180,000 |
Source: Public Records
Tax History Compared to Growth
Tax History
| Year | Tax Paid | Tax Assessment Tax Assessment Total Assessment is a certain percentage of the fair market value that is determined by local assessors to be the total taxable value of land and additions on the property. | Land | Improvement |
|---|---|---|---|---|
| 2024 | $9,543 | $18,000 | $3,796 | $14,204 |
| 2023 | $14,702 | $18,000 | $3,796 | $14,204 |
| 2022 | $14,702 | $17,422 | $3,322 | $14,100 |
| 2021 | $14,778 | $17,421 | $3,321 | $14,100 |
| 2020 | $13,650 | $17,421 | $3,321 | $14,100 |
| 2019 | $9,867 | $14,418 | $3,084 | $11,334 |
| 2018 | $9,610 | $14,418 | $3,084 | $11,334 |
| 2017 | $9,389 | $14,418 | $3,084 | $11,334 |
| 2016 | $9,152 | $13,570 | $2,847 | $10,723 |
| 2015 | $8,840 | $13,570 | $2,847 | $10,723 |
| 2014 | $8,590 | $13,570 | $2,847 | $10,723 |
| 2013 | $8,227 | $14,419 | $2,847 | $11,572 |
Source: Public Records
Map
Nearby Homes
- 305 Jackson St
- 508 Davis St
- 549 Homan Ave
- 307 Gettysburg St
- 500 Antietam St
- 242 Hickory St
- 519 Chase St
- 3422 Station Dr
- 410 Gettysburg St
- 120 Indiana St
- 21612 Wildflower Rd Unit 113-4
- 21209 Oak St
- 3133 Heritage Blvd
- 3533 212th Place
- 21628 Dogwood Rd Unit 1203
- 315 Sheridan St
- 3135 Nottingham Ct
- 3133 Nottingham Ct
- 413 Illinois St
- 21607 Main St