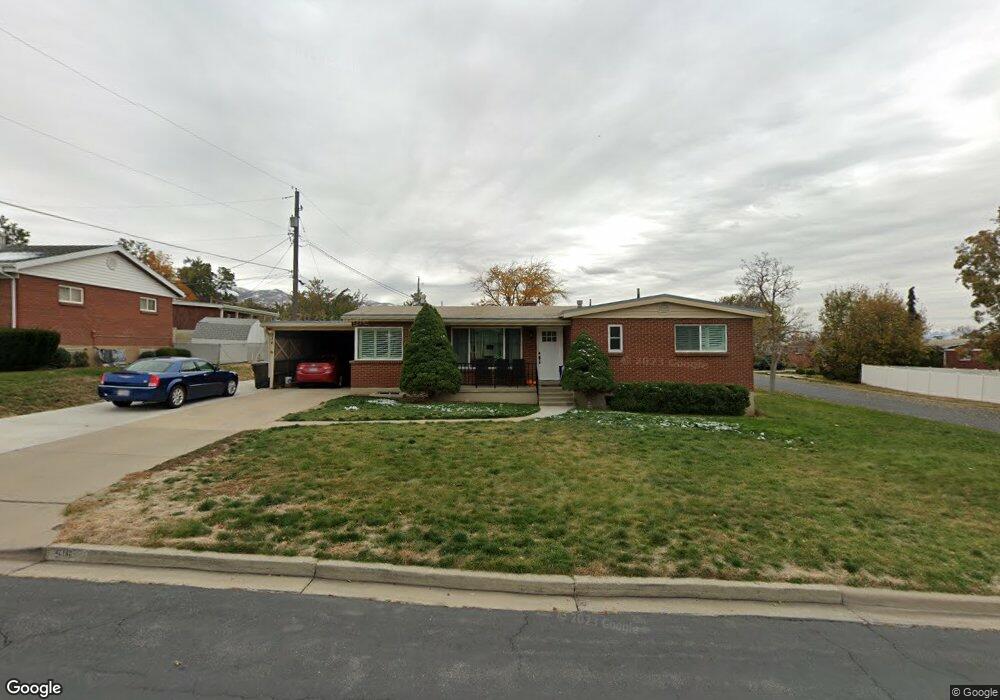
516 E 775 N Bountiful, UT 84010
Estimated Value: $475,000 - $565,000
3
Beds
1
Bath
2,220
Sq Ft
$227/Sq Ft
Est. Value
About This Home
This home is located at 516 E 775 N, Bountiful, UT 84010 and is currently estimated at $504,236, approximately $227 per square foot. 516 E 775 N is a home located in Davis County with nearby schools including Tolman School, Bountiful Junior High School, and Bountiful High School.
Ownership History
Date
Name
Owned For
Owner Type
Purchase Details
Closed on
Nov 12, 2020
Sold by
Peterson Alexander
Bought by
Peterson Alexander and Peterson Alison
Current Estimated Value
Home Financials for this Owner
Home Financials are based on the most recent Mortgage that was taken out on this home.
Original Mortgage
$337,075
Outstanding Balance
$299,264
Interest Rate
2.8%
Mortgage Type
New Conventional
Estimated Equity
$204,972
Purchase Details
Closed on
Feb 5, 2014
Sold by
Hutchinson Robert G
Bought by
Grandia Glenna H and Grandia Larry D
Purchase Details
Closed on
Oct 15, 1998
Sold by
Glenn R & Gladys L Hutchinson Revocable and Hutchinson Glenn R
Bought by
Hutchinson Gladys L and Gladys L Hutchinson Revocable Family Tr
Create a Home Valuation Report for This Property
The Home Valuation Report is an in-depth analysis detailing your home's value as well as a comparison with similar homes in the area
Purchase History
| Date | Buyer | Sale Price | Title Company |
|---|---|---|---|
| Peterson Alexander | -- | Us Title Company Of U | |
| Peterson Alexander | -- | Us Title Company Of U | |
| Grandia Glenna H | -- | First American Title | |
| Hutchinson Gladys L | -- | -- |
Source: Public Records
Mortgage History
| Date | Status | Borrower | Loan Amount |
|---|---|---|---|
| Open | Peterson Alexander | $337,075 |
Source: Public Records
Tax History
| Year | Tax Paid | Tax Assessment Tax Assessment Total Assessment is a certain percentage of the fair market value that is determined by local assessors to be the total taxable value of land and additions on the property. | Land | Improvement |
|---|---|---|---|---|
| 2025 | $2,673 | $240,900 | $117,413 | $123,487 |
| 2024 | $2,505 | $234,850 | $108,400 | $126,450 |
| 2023 | $2,404 | $409,000 | $194,659 | $214,341 |
| 2022 | $2,534 | $237,050 | $103,392 | $133,658 |
| 2021 | $2,327 | $333,000 | $153,511 | $179,489 |
| 2020 | $1,792 | $254,000 | $139,822 | $114,178 |
| 2019 | $1,811 | $251,000 | $141,968 | $109,032 |
| 2018 | $1,676 | $228,000 | $131,297 | $96,703 |
| 2016 | $1,443 | $106,205 | $40,232 | $65,973 |
| 2015 | $1,426 | $99,110 | $40,232 | $58,878 |
| 2014 | $1,407 | $100,810 | $40,232 | $60,578 |
| 2013 | -- | $97,172 | $41,748 | $55,424 |
Source: Public Records
Map
Nearby Homes
- 453 N 400 E Unit 7-D
- 345 N 400 E
- 662 E 1200 N
- 683 E 100 N
- 975 E 1050 N
- 1023 E 800 N
- 49 E 200 N Unit 4
- 41 E 200 N Unit 6
- 1420 N Main St
- 55 E 200 N Unit 2
- 51 E 200 N Unit 3
- 256 N Main St
- 254 N Main St
- 252 N Main St
- 610 E Pages Ln
- 1105 E 600 N
- 106 W 700 N
- 908 Northern Hills Dr Unit 3
- 933 Northern Hills Cir
- 967 S Courtyard Ln
Your Personal Tour Guide
Ask me questions while you tour the home.