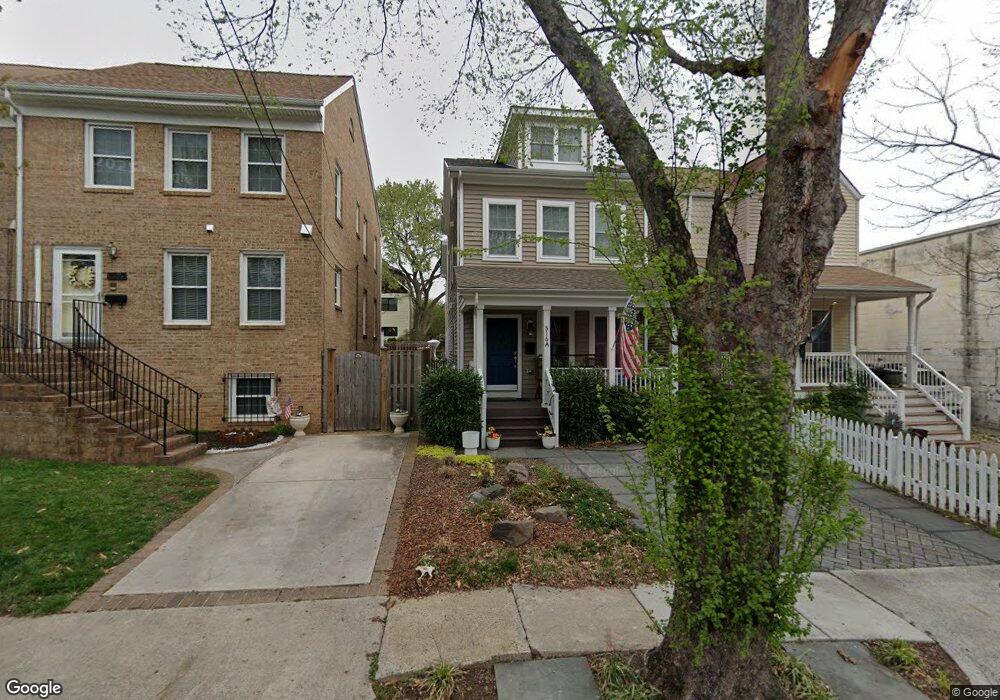
516 E Howell Ave Unit A Alexandria, VA 22301
Del Ray NeighborhoodEstimated Value: $1,220,000 - $1,550,000
3
Beds
3
Baths
2,329
Sq Ft
$583/Sq Ft
Est. Value
About This Home
This home is located at 516 E Howell Ave Unit A, Alexandria, VA 22301 and is currently estimated at $1,358,344, approximately $583 per square foot. 516 E Howell Ave Unit A is a home located in Alexandria City with nearby schools including Mount Vernon Community School, George Washington Middle School, and Alexandria City High School.
Ownership History
Date
Name
Owned For
Owner Type
Purchase Details
Closed on
Jul 16, 2012
Sold by
516A East Howell Avenue Llc
Bought by
Wannen John C
Current Estimated Value
Home Financials for this Owner
Home Financials are based on the most recent Mortgage that was taken out on this home.
Original Mortgage
$543,200
Outstanding Balance
$376,557
Interest Rate
3.76%
Mortgage Type
New Conventional
Estimated Equity
$981,787
Purchase Details
Closed on
Jul 13, 2011
Sold by
Alabama Ave Lc
Bought by
516A E Howell Avenue Llc
Home Financials for this Owner
Home Financials are based on the most recent Mortgage that was taken out on this home.
Original Mortgage
$400,000
Interest Rate
4.58%
Mortgage Type
Construction
Purchase Details
Closed on
Sep 23, 2010
Sold by
Drabkowski Douglas J
Bought by
Alabama Ave Lc
Purchase Details
Closed on
Aug 29, 2008
Sold by
Dingman Peter A
Bought by
Drabkowski Douglas J
Purchase Details
Closed on
Oct 17, 2002
Sold by
Baldwin Margaret D
Bought by
Peterson Eric L
Create a Home Valuation Report for This Property
The Home Valuation Report is an in-depth analysis detailing your home's value as well as a comparison with similar homes in the area
Home Values in the Area
Average Home Value in this Area
Purchase History
| Date | Buyer | Sale Price | Title Company |
|---|---|---|---|
| Wannen John C | $679,000 | -- | |
| 516A E Howell Avenue Llc | $219,000 | -- | |
| Alabama Ave Lc | $161,500 | -- | |
| Drabkowski Douglas J | $95,000 | -- | |
| Peterson Eric L | $791 | -- |
Source: Public Records
Mortgage History
| Date | Status | Borrower | Loan Amount |
|---|---|---|---|
| Open | Wannen John C | $543,200 | |
| Previous Owner | 516A E Howell Avenue Llc | $400,000 |
Source: Public Records
Tax History
| Year | Tax Paid | Tax Assessment Tax Assessment Total Assessment is a certain percentage of the fair market value that is determined by local assessors to be the total taxable value of land and additions on the property. | Land | Improvement |
|---|---|---|---|---|
| 2025 | $13,684 | $1,133,749 | $486,246 | $647,503 |
| 2024 | $13,684 | $1,133,749 | $486,246 | $647,503 |
| 2023 | $12,656 | $1,140,192 | $486,246 | $653,946 |
| 2022 | $12,341 | $1,111,826 | $467,544 | $644,282 |
| 2021 | $11,869 | $1,069,322 | $425,040 | $644,282 |
| 2020 | $12,262 | $1,052,199 | $425,040 | $627,159 |
| 2019 | $11,533 | $1,020,608 | $393,449 | $627,159 |
| 2018 | $11,183 | $989,652 | $381,990 | $607,662 |
| 2017 | $10,572 | $935,611 | $357,000 | $578,611 |
| 2016 | $9,171 | $854,714 | $357,000 | $497,714 |
| 2015 | $8,992 | $862,155 | $336,000 | $526,155 |
| 2014 | $7,632 | $731,781 | $219,847 | $511,934 |
Source: Public Records
Map
Nearby Homes
- 520 E Mount Ida Ave
- 2205 E Randolph Ave
- 2102 Main Line Blvd
- 2215 Richmond Hwy Unit 101
- 2113 Main Line Blvd
- 527 E Duncan Ave
- 1901 Main Line Blvd Unit 102
- 716 Diamond Ave
- 2403 Burke Ave
- 2406 Leslie Ave
- 738 Mckenzie Ave
- 1613 Potomac Greens Dr Unit A
- 2605 Fall Line St
- 402 Swann Ave
- 701 Swann Ave Unit 606
- 701 Swann Ave Unit 507
- 701 Swann Ave Unit 402
- 326 Swann Ave
- 715 Hawkins Way
- 737 Swann Ave Unit 607
- 516 E Howell Ave
- 514 E Howell Ave
- 512 E Howell Ave
- 518 E Howell Ave
- 510 E Howell Ave
- 510 E Howell Ave Unit A
- 510 E Howell Ave Unit B
- 510A E Howell Ave
- 2000 Richmond Hwy
- 517A E Howell Ave
- 510-B E Howell Ave
- 510 Howell Avenue A E
- 510 Howell Avenue B E
- 515 E Windsor Ave
- 517 E Windsor Ave
- 508 Howell Avenue A E
- 508 Howell Avenue A
- 513 E Windsor Ave
- 517 E Howell Ave Unit A
- 517 E Howell Ave
Your Personal Tour Guide
Ask me questions while you tour the home.