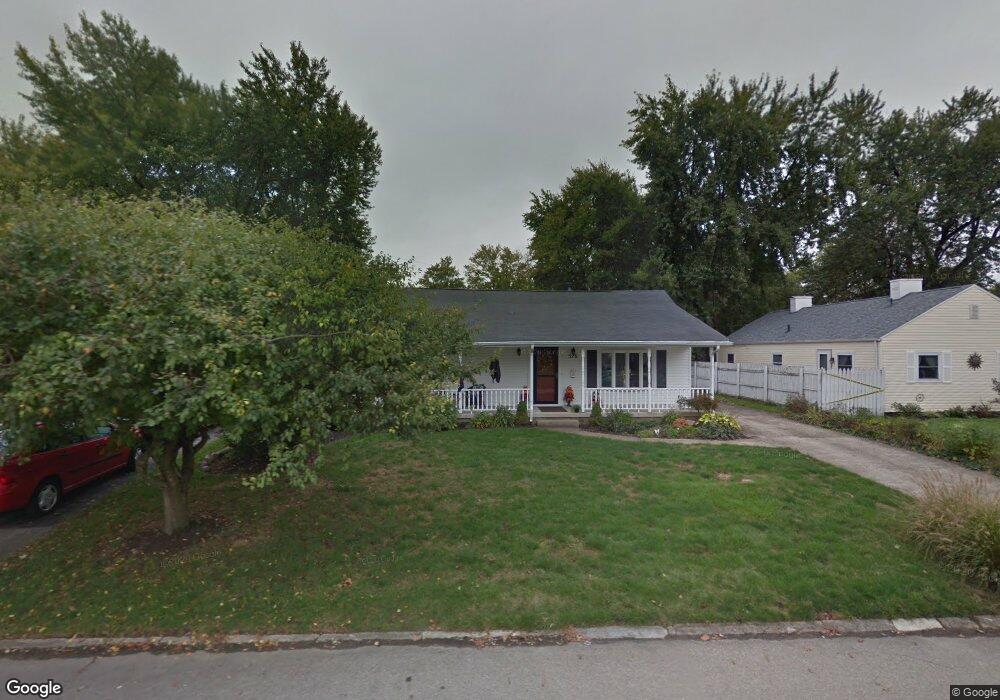
516 Earnshaw Dr Dayton, OH 45429
Estimated Value: $242,000 - $265,000
3
Beds
2
Baths
1,336
Sq Ft
$188/Sq Ft
Est. Value
About This Home
This home is located at 516 Earnshaw Dr, Dayton, OH 45429 and is currently estimated at $251,401, approximately $188 per square foot. 516 Earnshaw Dr is a home located in Montgomery County with nearby schools including Oakview Elementary School, Van Buren Middle School, and Kettering Fairmont High School.
Ownership History
Date
Name
Owned For
Owner Type
Purchase Details
Closed on
Mar 1, 2022
Sold by
Allbery Jenna M and Thoma Adam S
Bought by
Delong Gina
Current Estimated Value
Home Financials for this Owner
Home Financials are based on the most recent Mortgage that was taken out on this home.
Original Mortgage
$204,250
Outstanding Balance
$189,389
Interest Rate
3.89%
Mortgage Type
New Conventional
Estimated Equity
$62,012
Purchase Details
Closed on
May 5, 2020
Sold by
Poteet Tara R
Bought by
Stanfield Jessica and Stanfield Dillon
Home Financials for this Owner
Home Financials are based on the most recent Mortgage that was taken out on this home.
Original Mortgage
$185,250
Interest Rate
3.5%
Mortgage Type
New Conventional
Purchase Details
Closed on
Sep 30, 2016
Sold by
Harvey Janelle E and Harvey Andrew J
Bought by
Allbery Jenna M and Thomas Adam S
Home Financials for this Owner
Home Financials are based on the most recent Mortgage that was taken out on this home.
Original Mortgage
$93,600
Interest Rate
3.42%
Mortgage Type
New Conventional
Purchase Details
Closed on
Sep 16, 2016
Sold by
Horn Pamela J and Kerlin Pamela J
Bought by
Harvey Janelle E and Harvey Andrew J
Home Financials for this Owner
Home Financials are based on the most recent Mortgage that was taken out on this home.
Original Mortgage
$93,600
Interest Rate
3.42%
Mortgage Type
New Conventional
Purchase Details
Closed on
May 29, 2009
Sold by
Phm Properties Llc
Bought by
Harvey Janelle E and Harvey Andrew J
Home Financials for this Owner
Home Financials are based on the most recent Mortgage that was taken out on this home.
Original Mortgage
$91,600
Interest Rate
4.85%
Mortgage Type
Purchase Money Mortgage
Purchase Details
Closed on
Jan 16, 2009
Sold by
Wells Fargo Bank Na
Bought by
Phm Properties Llc
Purchase Details
Closed on
Jan 12, 2009
Sold by
Kerlin Timothy F
Bought by
Wells Fargo Bank Na
Purchase Details
Closed on
Mar 23, 2007
Sold by
Whigham Robert N and Whigham Susan Elaine
Bought by
Kerlin Timothy F
Home Financials for this Owner
Home Financials are based on the most recent Mortgage that was taken out on this home.
Original Mortgage
$127,800
Interest Rate
6.25%
Mortgage Type
Purchase Money Mortgage
Purchase Details
Closed on
Apr 1, 2002
Sold by
Whigham Robert N and Elaine Susan
Bought by
Whigham Robert N and Whigham Susan Elaine
Home Financials for this Owner
Home Financials are based on the most recent Mortgage that was taken out on this home.
Original Mortgage
$108,000
Interest Rate
6.82%
Create a Home Valuation Report for This Property
The Home Valuation Report is an in-depth analysis detailing your home's value as well as a comparison with similar homes in the area
Home Values in the Area
Average Home Value in this Area
Purchase History
| Date | Buyer | Sale Price | Title Company |
|---|---|---|---|
| Delong Gina | -- | Landmark Title | |
| Stanfield Jessica | $195,000 | Sterling Land Title Agcy Inc | |
| Allbery Jenna M | $117,000 | Landmark Title Agency South | |
| Harvey Janelle E | -- | Landmark Title Agency South | |
| Harvey Janelle E | $117,000 | Multiple | |
| Phm Properties Llc | $55,000 | None Available | |
| Wells Fargo Bank Na | $72,000 | None Available | |
| Kerlin Timothy F | $134,900 | Integrity Land Title Llc | |
| Whigham Robert N | -- | -- |
Source: Public Records
Mortgage History
| Date | Status | Borrower | Loan Amount |
|---|---|---|---|
| Open | Delong Gina | $204,250 | |
| Previous Owner | Stanfield Jessica | $185,250 | |
| Previous Owner | Allbery Jenna M | $93,600 | |
| Previous Owner | Harvey Janelle E | $91,600 | |
| Previous Owner | Kerlin Timothy F | $127,800 | |
| Previous Owner | Whigham Robert N | $108,000 |
Source: Public Records
Tax History
| Year | Tax Paid | Tax Assessment Tax Assessment Total Assessment is a certain percentage of the fair market value that is determined by local assessors to be the total taxable value of land and additions on the property. | Land | Improvement |
|---|---|---|---|---|
| 2025 | $3,549 | $55,010 | $13,990 | $41,020 |
| 2024 | $3,449 | $55,010 | $13,990 | $41,020 |
| 2023 | $3,449 | $55,010 | $13,990 | $41,020 |
| 2022 | $3,170 | $39,910 | $10,140 | $29,770 |
| 2021 | $2,935 | $39,910 | $10,140 | $29,770 |
| 2020 | $2,943 | $39,910 | $10,140 | $29,770 |
| 2019 | $3,125 | $37,510 | $10,140 | $27,370 |
| 2018 | $3,141 | $37,510 | $10,140 | $27,370 |
| 2017 | $2,896 | $37,510 | $10,140 | $27,370 |
| 2016 | $3,000 | $33,230 | $10,140 | $23,090 |
| 2015 | $2,880 | $33,230 | $10,140 | $23,090 |
| 2014 | $2,880 | $33,230 | $10,140 | $23,090 |
| 2012 | -- | $36,400 | $10,150 | $26,250 |
Source: Public Records
Map
Nearby Homes
- 500 Schuyler Dr
- 3854 Shroyer Rd
- 639 Storms Rd
- 326 N Bromfield Rd
- 3716 Wenzler Dr
- 3826 California Ave
- 3737 Saranac Dr
- 110 Lincoln Park Blvd Unit 110
- 1905 Tait Rd
- 117 Balmoral Dr
- 3487 Far Hills Ave
- 791 Ashton Cir Unit 103
- 889 Timberlake Ct
- 4008 Ackerman Blvd
- 587 Cottingwood Ct
- 876 Timberlake Ct
- 804 Hollendale Dr
- 639 Rockhill Ave
- 825 Lincoln Woods Ct
- 654 Cushing Ave
- 512 Earnshaw Dr
- 520 Earnshaw Dr
- 517 Carrlands Dr
- 508 Earnshaw Dr
- 513 Carrlands Dr
- 521 Carrlands Dr
- 524 Earnshaw Dr
- 517 Earnshaw Dr
- 509 Carrlands Dr
- 513 Earnshaw Dr
- 525 Carrlands Dr
- 521 Earnshaw Dr
- 504 Earnshaw Dr
- 509 Earnshaw Dr
- 3801 Lefevre Dr
- 505 Carrlands Dr
- 505 Earnshaw Dr
- 525 Earnshaw Dr
- 529 Carrlands Dr
- 3850 Shroyer Rd
Your Personal Tour Guide
Ask me questions while you tour the home.