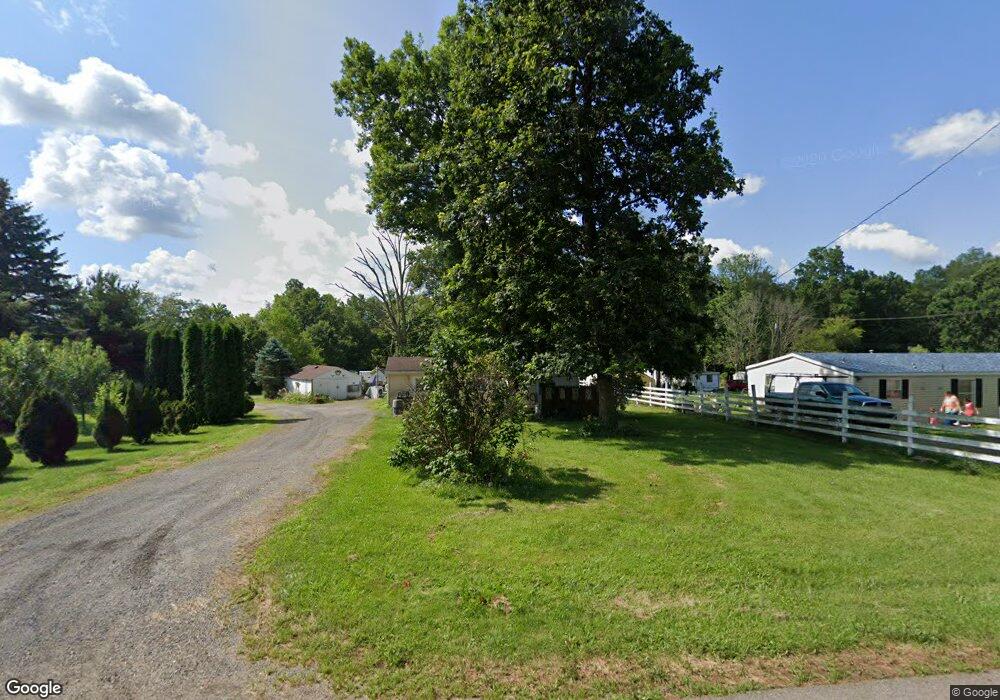
516 Fleming Falls Rd Mansfield, OH 44905
Estimated Value: $136,863 - $200,000
3
Beds
1
Bath
1,284
Sq Ft
$133/Sq Ft
Est. Value
About This Home
This home is located at 516 Fleming Falls Rd, Mansfield, OH 44905 and is currently estimated at $170,466, approximately $132 per square foot. 516 Fleming Falls Rd is a home located in Richland County with nearby schools including Temple-Christian School, St. Peter's Elementary/Montessori School, and St. Peter's Junior High / High School.
Ownership History
Date
Name
Owned For
Owner Type
Purchase Details
Closed on
Apr 13, 2006
Sold by
Mccormick Stoner Edith L and Stoner John
Bought by
Medley Monica S
Current Estimated Value
Home Financials for this Owner
Home Financials are based on the most recent Mortgage that was taken out on this home.
Original Mortgage
$77,500
Outstanding Balance
$44,485
Interest Rate
6.34%
Mortgage Type
Fannie Mae Freddie Mac
Estimated Equity
$125,981
Create a Home Valuation Report for This Property
The Home Valuation Report is an in-depth analysis detailing your home's value as well as a comparison with similar homes in the area
Home Values in the Area
Average Home Value in this Area
Purchase History
| Date | Buyer | Sale Price | Title Company |
|---|---|---|---|
| Medley Monica S | $77,500 | Southern Title |
Source: Public Records
Mortgage History
| Date | Status | Borrower | Loan Amount |
|---|---|---|---|
| Open | Medley Monica S | $77,500 |
Source: Public Records
Tax History
| Year | Tax Paid | Tax Assessment Tax Assessment Total Assessment is a certain percentage of the fair market value that is determined by local assessors to be the total taxable value of land and additions on the property. | Land | Improvement |
|---|---|---|---|---|
| 2024 | $1,991 | $37,030 | $11,090 | $25,940 |
| 2023 | $2,034 | $37,030 | $11,090 | $25,940 |
| 2022 | $1,919 | $28,750 | $9,910 | $18,840 |
| 2021 | $1,930 | $28,750 | $9,910 | $18,840 |
| 2020 | $1,966 | $28,750 | $9,910 | $18,840 |
| 2019 | $1,873 | $24,400 | $8,400 | $16,000 |
| 2018 | $1,765 | $24,400 | $8,400 | $16,000 |
| 2017 | $1,700 | $24,400 | $8,400 | $16,000 |
| 2016 | $1,682 | $23,000 | $7,980 | $15,020 |
| 2015 | $1,682 | $23,000 | $7,980 | $15,020 |
| 2014 | $1,557 | $23,000 | $7,980 | $15,020 |
| 2012 | $646 | $24,210 | $8,400 | $15,810 |
Source: Public Records
Map
Nearby Homes
- 0 Wesley
- 573 Caldwell Ave
- 943 Yale Ave
- 411 Grace St
- 387 Auburn St
- 0 Lenox Ave
- 961 Neil Cir N
- 1168 ConcheMcO St
- 1359 N Stewart Rd
- 382 Orange St
- 888 Beal Rd
- 1217 Evergreen Ave W
- 118 Raymond Ave
- 646 Fleetwood Rd
- 580 N Mulberry St
- 644 Skyline Rd
- 607 Skyline Rd
- 1226 Evergreen Ave W
- 683 Coachman Rd
- 0 Grant Rd Unit 5190994
- 508 Fleming Falls Rd
- 526 Fleming Falls Rd
- 504 Fleming Falls Rd
- 929 5th Ave
- 532 Fleming Falls Rd
- 963 5th Ave
- 492 Fleming Falls Rd
- 954 5th Ave
- 942 5th Ave
- 917 5th Ave
- 911 5th Ave
- 480 Fleming Falls Rd
- 960 5th Ave
- 921 5th Ave
- 571 Darbydale Rd
- 901 5th Ave
- 570 Fleming Falls Rd
- 988 5th Ave
- 899 5th Ave
- 567 Fleming Falls Rd
Your Personal Tour Guide
Ask me questions while you tour the home.