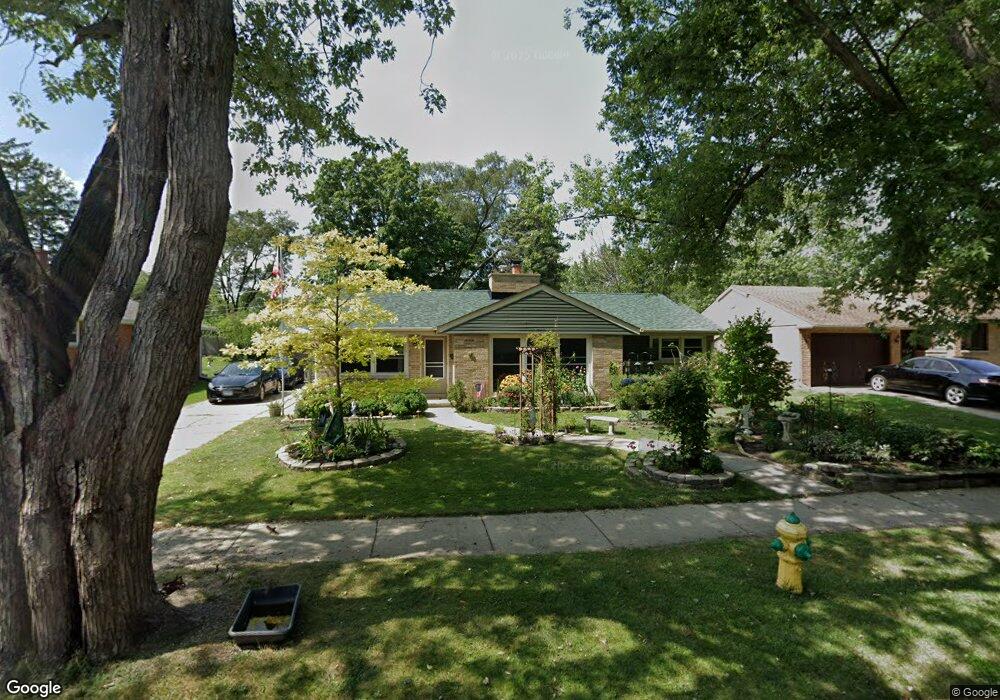
516 Flossmoor Ave Waukegan, IL 60085
West Waukegan NeighborhoodEstimated Value: $240,000 - $283,000
3
Beds
2
Baths
1,232
Sq Ft
$212/Sq Ft
Est. Value
About This Home
This home is located at 516 Flossmoor Ave, Waukegan, IL 60085 and is currently estimated at $261,088, approximately $211 per square foot. 516 Flossmoor Ave is a home located in Lake County with nearby schools including Whittier Elementary School, Robert E. Abbott Middle School, and Waukegan High School.
Ownership History
Date
Name
Owned For
Owner Type
Purchase Details
Closed on
Jun 10, 2010
Sold by
Cabrera Jorge
Bought by
Whitener Larry E and Whitener Wendi E
Current Estimated Value
Home Financials for this Owner
Home Financials are based on the most recent Mortgage that was taken out on this home.
Original Mortgage
$85,000
Outstanding Balance
$56,967
Interest Rate
4.97%
Mortgage Type
VA
Estimated Equity
$204,121
Purchase Details
Closed on
Feb 20, 2005
Sold by
Zires Luis
Bought by
Cabrera Jorge
Home Financials for this Owner
Home Financials are based on the most recent Mortgage that was taken out on this home.
Original Mortgage
$151,680
Interest Rate
6.75%
Mortgage Type
Purchase Money Mortgage
Purchase Details
Closed on
May 11, 2004
Sold by
Heim Mori M and Heim Leanne K
Bought by
Zires Luis
Create a Home Valuation Report for This Property
The Home Valuation Report is an in-depth analysis detailing your home's value as well as a comparison with similar homes in the area
Home Values in the Area
Average Home Value in this Area
Purchase History
| Date | Buyer | Sale Price | Title Company |
|---|---|---|---|
| Whitener Larry E | $85,000 | Chicago Title Insurance Co | |
| Cabrera Jorge | $190,000 | -- | |
| Zires Luis | $128,000 | First American Title |
Source: Public Records
Mortgage History
| Date | Status | Borrower | Loan Amount |
|---|---|---|---|
| Open | Whitener Larry E | $85,000 | |
| Previous Owner | Cabrera Jorge | $151,680 | |
| Closed | Cabrera Jorge | $37,920 |
Source: Public Records
Tax History Compared to Growth
Tax History
| Year | Tax Paid | Tax Assessment Tax Assessment Total Assessment is a certain percentage of the fair market value that is determined by local assessors to be the total taxable value of land and additions on the property. | Land | Improvement |
|---|---|---|---|---|
| 2024 | $5,308 | $71,810 | $15,176 | $56,634 |
| 2023 | $5,124 | $64,292 | $13,587 | $50,705 |
| 2022 | $5,124 | $58,414 | $11,560 | $46,854 |
| 2021 | $4,981 | $53,779 | $10,693 | $43,086 |
| 2020 | $4,999 | $50,102 | $9,962 | $40,140 |
| 2019 | $4,979 | $45,911 | $9,129 | $36,782 |
| 2018 | $4,518 | $41,324 | $11,747 | $29,577 |
| 2017 | $4,347 | $36,560 | $10,393 | $26,167 |
| 2016 | $3,982 | $31,769 | $9,031 | $22,738 |
| 2015 | $3,790 | $28,434 | $8,083 | $20,351 |
| 2014 | $2,501 | $20,321 | $8,499 | $11,822 |
| 2012 | $3,320 | $22,015 | $9,208 | $12,807 |
Source: Public Records
Map
Nearby Homes
- 0 Brookside Ave
- 615 Tiffany Dr
- 2115 Lydia St
- 1213 Grand Ave
- 24 Washington Terrace
- 102 Baldwin Ave
- 621 N Austin Ave
- 1005 N Lewis Ave
- 34887 N Austin Ave
- 603 N Austin Ave
- 1023 N Elmwood Ave
- 132 Dorchester Ct
- 12698 W Grandview Ave
- 2813 Theresa Ave
- 12716 W Grandview Ave
- 3170 W Monroe St Unit 309
- 1038 Indiana Ave
- 968 Judge Ave
- 49 S Lewis Ave
- 824 N Butrick St
- 524 Flossmoor Ave
- 510 Flossmoor Ave
- 504 Flossmoor Ave
- 528 Flossmoor Ave
- 517 N Mcaree Rd
- 521 N Mcaree Rd
- 511 N Mcaree Rd
- 523 N Mcaree Rd
- 517 Flossmoor Ave
- 507 N Mcaree Rd
- 511 Flossmoor Ave
- 521 Flossmoor Ave
- 532 Flossmoor Ave
- 500 Flossmoor Ave
- 527 N Mcaree Rd
- 507 Flossmoor Ave
- 525 Flossmoor Ave
- 503 N Mcaree Rd
- 503 Flossmoor Ave
- 531 N Mcaree Rd