516 Forest Ave Aurora, IL 60505
Pigeon Hill NeighborhoodEstimated Value: $256,703 - $274,000
About This Home
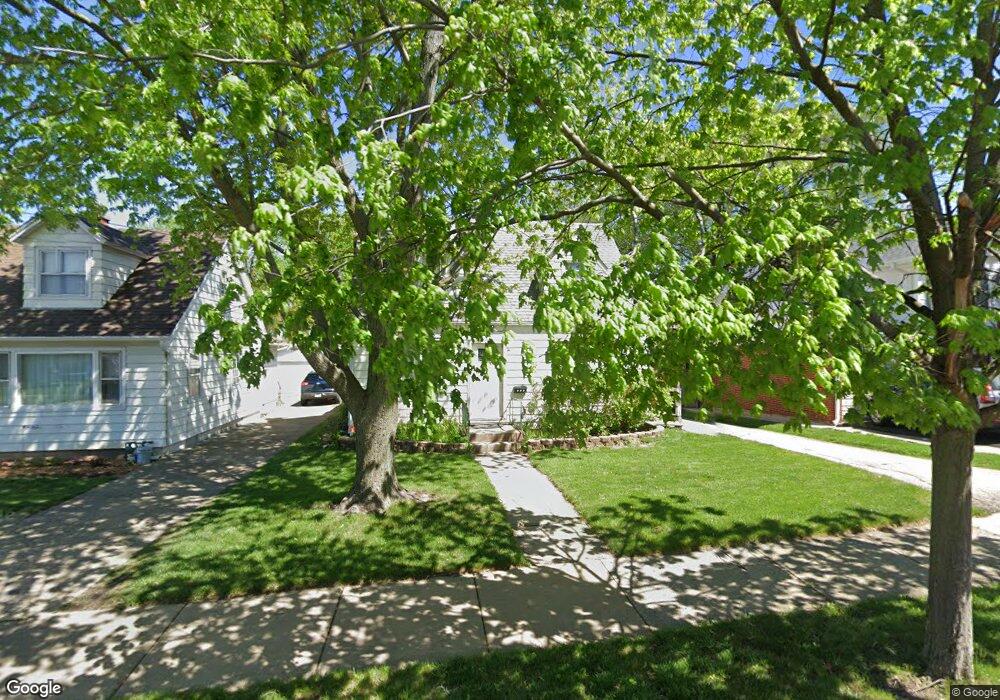
This home is located at 516 Forest Ave, Aurora, IL 60505 and is currently estimated at $263,676, approximately $237 per square foot. 516 Forest Ave is a home located in Kane County with nearby schools including Nicholas A Hermes Elementary School, Simmons Middle School, and East Aurora High School.
Ownership History
We collect this data history from publicly available records. To have your information removed, we recommend requesting removal directly through your county’s website.
Purchase Details
Home Financials for this Owner
Home Financials are based on the most recent Mortgage that was taken out on this home.Purchase Details
Home Financials for this Owner
Home Financials are based on the most recent Mortgage that was taken out on this home.Purchase Details
Home Financials for this Owner
Home Financials are based on the most recent Mortgage that was taken out on this home.Home Values in the Area
Average Home Value in this Area
Purchase History
We collect this data history from publicly available records. To have your information removed, we recommend requesting removal directly through your county’s website.
| Date | Buyer | Sale Price | Title Company |
|---|---|---|---|
| $190,000 | Amrock Llc | ||
| $160,000 | Multiple | ||
| $80,000 | -- |
Mortgage History
We collect this data history from publicly available records. To have your information removed, we recommend requesting removal directly through your county’s website.
| Date | Status | Borrower | Loan Amount |
|---|---|---|---|
| Open | $169,140 | ||
| Previous Owner | $144,000 | ||
| Previous Owner | $79,600 |
Tax History
We collect this data history from publicly available records. To have your information removed, we recommend requesting removal directly through your county’s website.
| Year | Tax Paid | Tax Assessment Tax Assessment Total Assessment is a certain percentage of the fair market value that is determined by local assessors to be the total taxable value of land and additions on the property. | Land | Improvement |
|---|---|---|---|---|
| 2024 | $4,026 | $66,722 | $9,711 | $57,011 |
| 2023 | $3,857 | $59,616 | $8,677 | $50,939 |
| 2022 | $3,615 | $53,577 | $7,917 | $45,660 |
| 2021 | $3,543 | $49,881 | $7,371 | $42,510 |
| 2020 | $3,354 | $46,332 | $6,847 | $39,485 |
| 2019 | $3,254 | $42,928 | $6,344 | $36,584 |
| 2018 | $2,747 | $36,167 | $5,868 | $30,299 |
| 2017 | $2,458 | $31,068 | $5,407 | $25,661 |
| 2016 | $2,445 | $29,230 | $4,635 | $24,595 |
| 2015 | -- | $25,158 | $3,986 | $21,172 |
| 2014 | -- | $23,140 | $3,663 | $19,477 |
| 2013 | -- | $23,390 | $4,190 | $19,200 |
Map
- 304 Hankes Ave
- 1105 Assell Ave
- 617 Cleveland St
- 1140 Church Rd
- 697 N Ohio St
- 719 Orchard Ave
- 1150 Lehnertz Ave
- 912 Solfisburg Ave
- 817 Front St
- 479 N Lake St
- 469 N Lake St
- 231-233 Williams St
- 1045 Palace St
- 1000 Grand Ave
- 355 Lawndale Ave
- 361 Trask St
- 0000 N Farnsworth Ave
- 1221 Comet Dr
- 356 Lakelawn Blvd
- 934 Pennsylvania Ave
Ask me questions while you tour the home.