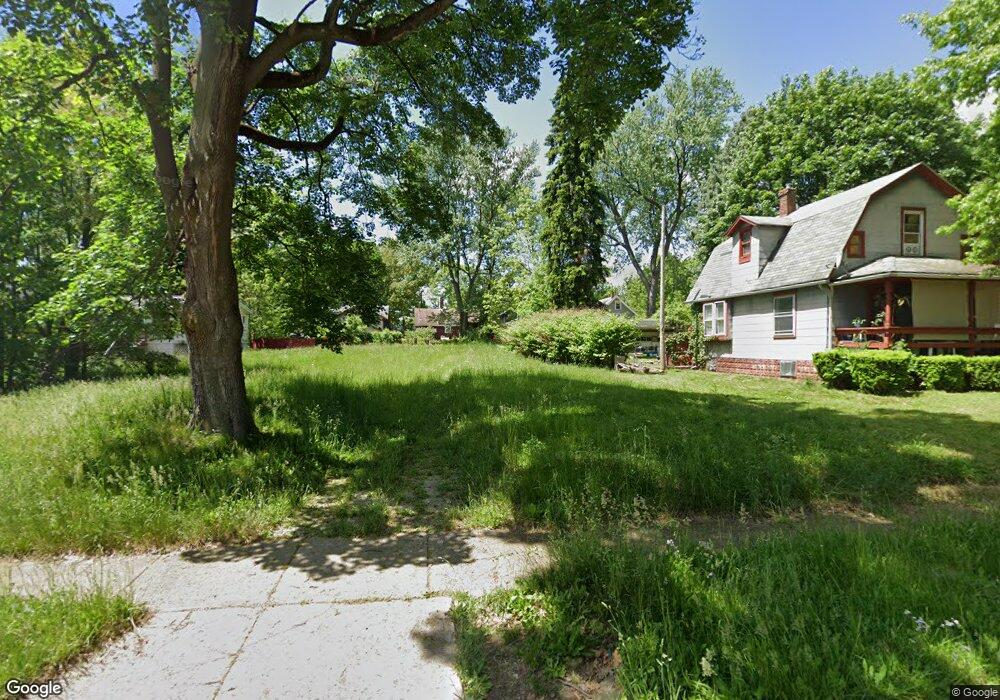
516 Gridley St Akron, OH 44306
Downtown Akron NeighborhoodEstimated Value: $82,000 - $151,000
3
Beds
1
Bath
676
Sq Ft
$170/Sq Ft
Est. Value
About This Home
This home is located at 516 Gridley St, Akron, OH 44306 and is currently estimated at $114,878, approximately $169 per square foot. 516 Gridley St is a home located in Summit County with nearby schools including Case Preparatory Academy, Middlebury Academy, and Arlington Christian Academy.
Ownership History
Date
Name
Owned For
Owner Type
Purchase Details
Closed on
Aug 26, 2005
Sold by
Townsend Tommie L
Bought by
Williams Eric J
Current Estimated Value
Home Financials for this Owner
Home Financials are based on the most recent Mortgage that was taken out on this home.
Original Mortgage
$56,000
Outstanding Balance
$34,610
Interest Rate
8.43%
Mortgage Type
Fannie Mae Freddie Mac
Estimated Equity
$80,268
Purchase Details
Closed on
Jan 24, 2005
Sold by
Jacobs Todd
Bought by
Townsend Tommie L
Purchase Details
Closed on
Nov 24, 2003
Sold by
Citifinancial Mortgage Co Inc
Bought by
Jacobs Todd
Purchase Details
Closed on
Sep 17, 2003
Sold by
Clowser Burton
Bought by
Citifinancial Mortgage Co Inc and Associates Home Equity Services Inc
Purchase Details
Closed on
Nov 27, 1996
Sold by
Wilson Herbert P
Bought by
Hinkle Donna L
Create a Home Valuation Report for This Property
The Home Valuation Report is an in-depth analysis detailing your home's value as well as a comparison with similar homes in the area
Home Values in the Area
Average Home Value in this Area
Purchase History
| Date | Buyer | Sale Price | Title Company |
|---|---|---|---|
| Williams Eric J | $70,000 | -- | |
| Townsend Tommie L | $8,000 | Clear Title Solutions | |
| Jacobs Todd | $8,250 | -- | |
| Citifinancial Mortgage Co Inc | $20,000 | -- | |
| Hinkle Donna L | $10,000 | -- |
Source: Public Records
Mortgage History
| Date | Status | Borrower | Loan Amount |
|---|---|---|---|
| Open | Williams Eric J | $56,000 |
Source: Public Records
Tax History
| Year | Tax Paid | Tax Assessment Tax Assessment Total Assessment is a certain percentage of the fair market value that is determined by local assessors to be the total taxable value of land and additions on the property. | Land | Improvement |
|---|---|---|---|---|
| 2025 | $37,712 | $3,483 | $3,483 | -- |
| 2024 | $37,712 | $3,483 | $3,483 | -- |
| 2023 | $236 | $3,483 | $3,483 | -- |
| 2022 | $236 | $2,401 | $2,401 | $0 |
| 2021 | $236 | $2,401 | $2,401 | $0 |
Source: Public Records
Map
Nearby Homes
Your Personal Tour Guide
Ask me questions while you tour the home.