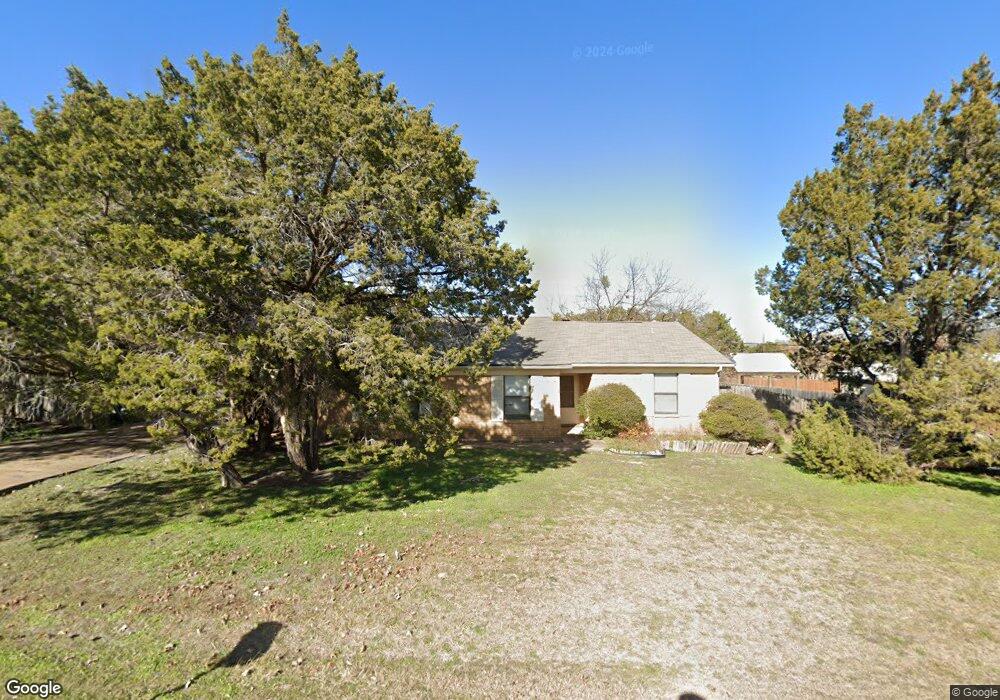
516 Heritage Trail Granbury, TX 76048
Estimated Value: $247,000 - $287,000
3
Beds
2
Baths
1,893
Sq Ft
$138/Sq Ft
Est. Value
About This Home
This home is located at 516 Heritage Trail, Granbury, TX 76048 and is currently estimated at $260,656, approximately $137 per square foot. 516 Heritage Trail is a home located in Hood County with nearby schools including STEAM Academy at Mambrino, Granbury Middle School, and Granbury High School.
Ownership History
Date
Name
Owned For
Owner Type
Purchase Details
Closed on
Feb 4, 2015
Sold by
Pcm Real Estate Investments Llc
Bought by
Hensley Steven J
Current Estimated Value
Home Financials for this Owner
Home Financials are based on the most recent Mortgage that was taken out on this home.
Original Mortgage
$116,844
Outstanding Balance
$90,413
Interest Rate
4.12%
Mortgage Type
FHA
Estimated Equity
$170,243
Purchase Details
Closed on
May 29, 2008
Sold by
James Thomas L and Estate Of Keith Eldon James
Bought by
Pcm Real Estate Investments Llc
Home Financials for this Owner
Home Financials are based on the most recent Mortgage that was taken out on this home.
Original Mortgage
$97,500
Interest Rate
6.07%
Mortgage Type
Purchase Money Mortgage
Purchase Details
Closed on
Dec 29, 1993
Sold by
James Keith E
Bought by
Hensley Steven J
Purchase Details
Closed on
Aug 23, 1988
Sold by
Sims Charlie
Bought by
Hensley Steven J
Create a Home Valuation Report for This Property
The Home Valuation Report is an in-depth analysis detailing your home's value as well as a comparison with similar homes in the area
Home Values in the Area
Average Home Value in this Area
Purchase History
| Date | Buyer | Sale Price | Title Company |
|---|---|---|---|
| Hensley Steven J | -- | Central Texas Title | |
| Pcm Real Estate Investments Llc | -- | None Available | |
| Hensley Steven J | -- | -- | |
| Hensley Steven J | -- | -- |
Source: Public Records
Mortgage History
| Date | Status | Borrower | Loan Amount |
|---|---|---|---|
| Open | Hensley Steven J | $116,844 | |
| Previous Owner | Pcm Real Estate Investments Llc | $97,500 |
Source: Public Records
Tax History Compared to Growth
Tax History
| Year | Tax Paid | Tax Assessment Tax Assessment Total Assessment is a certain percentage of the fair market value that is determined by local assessors to be the total taxable value of land and additions on the property. | Land | Improvement |
|---|---|---|---|---|
| 2025 | $2,944 | $245,480 | $70,000 | $175,480 |
| 2024 | $2,926 | $240,430 | $70,000 | $170,430 |
| 2023 | $2,932 | $240,950 | $70,000 | $170,950 |
| 2022 | $2,429 | $182,540 | $40,000 | $142,540 |
| 2021 | $2,520 | $164,160 | $38,000 | $126,160 |
| 2020 | $2,162 | $139,190 | $7,000 | $132,190 |
| 2019 | $2,093 | $128,760 | $7,000 | $121,760 |
| 2018 | $1,691 | $104,000 | $7,000 | $97,000 |
| 2017 | $1,785 | $106,770 | $7,000 | $99,770 |
| 2016 | $1,750 | $104,630 | $7,000 | $97,630 |
| 2015 | $1,581 | $95,420 | $7,000 | $88,420 |
| 2014 | $1,581 | $95,420 | $7,000 | $88,420 |
Source: Public Records
Map
Nearby Homes
- 2702 Brazos River Dr
- 2704 Brazos River Dr
- 913 Bosque River Dr
- 1031 Corral Dr
- 913 Pease River Dr
- 916 Devils River Dr
- 2407 Vineyard Dr
- 508 Crestwood Dr
- 323 Heritage Trail
- 1206 Sierra Vista Dr
- 924 Colorado River Dr
- 3211 Brazos River Dr
- 916 Colorado River Dr
- 2518 Elk Trail
- 3320 Brazos River Dr
- 933 Colorado River Dr
- 3317 Brazos River Dr
- 2612 Orion Way
- 1104 Sierra Vista Dr
- 921 Thicket Trail
- 600 Heritage Trail
- 2400 Woodhaven Dr
- 517 Heritage Trail
- 515 Heritage Trail
- 2404 Woodhaven Dr
- 604 Heritage Trail
- 519 Heritage Trail
- 513 Heritage Trail
- 606 Heritage Trail
- 603 Heritage Trail
- 3015 Brazos River Dr
- 605 Heritage Trail
- 2403 Woodhaven Dr
- 511 Heritage Trail
- 3005 Brazos River Dr
- 3019 Brazos River Dr
- 3021 Brazos River Dr
- 2408 Woodhaven Dr
- 607 Heritage Trail
- 2405 Woodhaven Dr