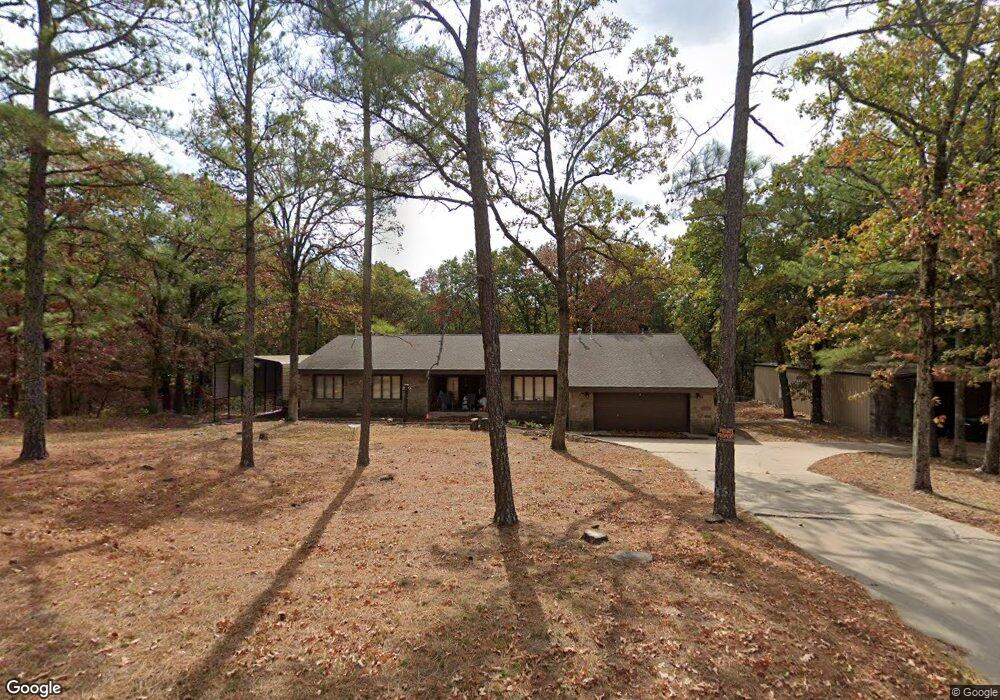
516 Kim St Tahlequah, OK 74464
Estimated Value: $265,000 - $343,000
3
Beds
3
Baths
2,704
Sq Ft
$116/Sq Ft
Est. Value
About This Home
This home is located at 516 Kim St, Tahlequah, OK 74464 and is currently estimated at $312,687, approximately $115 per square foot. 516 Kim St is a home located in Cherokee County with nearby schools including Cherokee Elementary School, Greenwood Elementary School, and Tahlequah Middle School.
Ownership History
Date
Name
Owned For
Owner Type
Purchase Details
Closed on
Jul 26, 2006
Sold by
Wheeler Clifford E
Bought by
Boatright Kirk E and Boatright Linda Kay
Current Estimated Value
Home Financials for this Owner
Home Financials are based on the most recent Mortgage that was taken out on this home.
Original Mortgage
$231,069
Interest Rate
8.25%
Mortgage Type
FHA
Purchase Details
Closed on
Jan 15, 2003
Sold by
Clifford and Carol Wheeler
Bought by
Clifford&Carol Wheeler Tr
Create a Home Valuation Report for This Property
The Home Valuation Report is an in-depth analysis detailing your home's value as well as a comparison with similar homes in the area
Home Values in the Area
Average Home Value in this Area
Purchase History
| Date | Buyer | Sale Price | Title Company |
|---|---|---|---|
| Boatright Kirk E | $230,000 | American Eagle Title Insuran | |
| Clifford&Carol Wheeler Tr | -- | -- |
Source: Public Records
Mortgage History
| Date | Status | Borrower | Loan Amount |
|---|---|---|---|
| Closed | Boatright Kirk E | $231,069 |
Source: Public Records
Tax History Compared to Growth
Tax History
| Year | Tax Paid | Tax Assessment Tax Assessment Total Assessment is a certain percentage of the fair market value that is determined by local assessors to be the total taxable value of land and additions on the property. | Land | Improvement |
|---|---|---|---|---|
| 2025 | $2,304 | $27,180 | $3,163 | $24,017 |
| 2024 | $2,304 | $27,755 | $3,163 | $24,592 |
| 2023 | $2,304 | $29,792 | $7,219 | $22,573 |
| 2022 | $2,013 | $28,373 | $5,800 | $22,573 |
| 2021 | $1,917 | $27,022 | $4,449 | $22,573 |
| 2020 | $1,826 | $25,737 | $3,163 | $22,574 |
| 2019 | $1,995 | $25,737 | $3,163 | $22,574 |
| 2018 | $2,248 | $28,792 | $3,795 | $24,997 |
| 2017 | $2,153 | $27,421 | $3,795 | $23,626 |
| 2016 | $2,065 | $26,115 | $3,795 | $22,320 |
| 2015 | $1,993 | $24,871 | $3,795 | $21,076 |
| 2014 | $1,993 | $25,300 | $1,381 | $23,919 |
Source: Public Records
Map
Nearby Homes