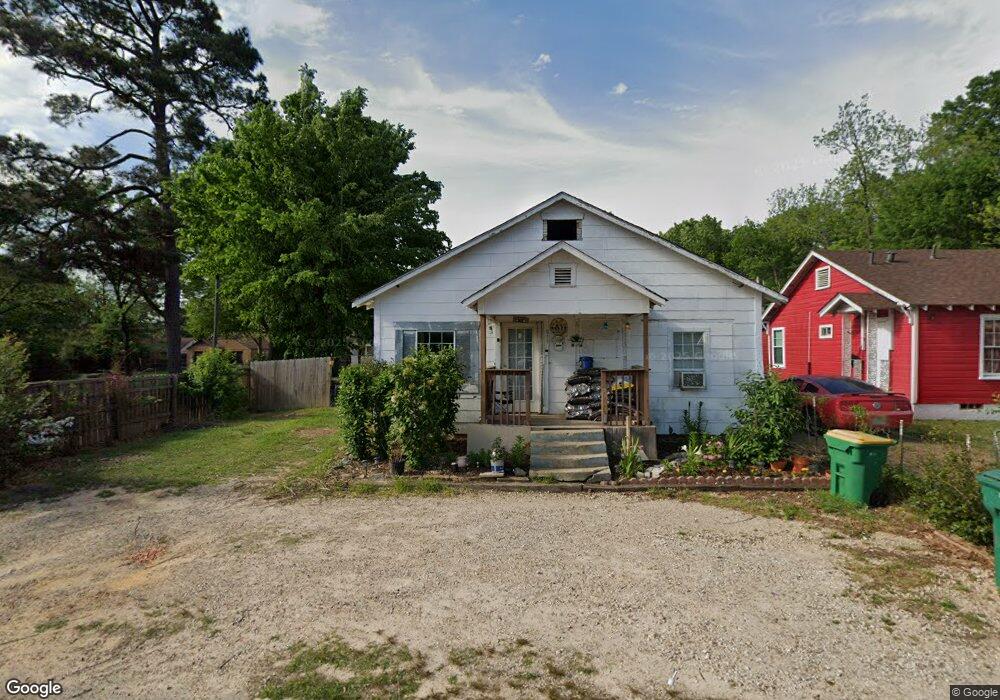
516 Lumpkin St Texarkana, TX 75501
Estimated Value: $60,443 - $85,000
--
Bed
--
Bath
1,219
Sq Ft
$56/Sq Ft
Est. Value
About This Home
This home is located at 516 Lumpkin St, Texarkana, TX 75501 and is currently estimated at $68,111, approximately $55 per square foot. 516 Lumpkin St is a home located in Bowie County with nearby schools including Theron Jones Early Literacy Center, Westlawn Elementary School, and Texas Middle School.
Ownership History
Date
Name
Owned For
Owner Type
Purchase Details
Closed on
Jul 13, 2012
Sold by
Sanchez Jose and Sanchez Guillermina
Bought by
Cordova Silvia Sanchez De and Cordova Manuel
Current Estimated Value
Home Financials for this Owner
Home Financials are based on the most recent Mortgage that was taken out on this home.
Original Mortgage
$19,000
Outstanding Balance
$13,143
Interest Rate
3.79%
Mortgage Type
Future Advance Clause Open End Mortgage
Estimated Equity
$54,968
Purchase Details
Closed on
Jul 8, 2011
Sold by
Swartz & Brough Inc
Bought by
Sanchez Jose and Sanchez Guillermina
Purchase Details
Closed on
Dec 15, 2010
Sold by
Murphy William
Bought by
Swartz & Brough Inc
Purchase Details
Closed on
Apr 4, 2007
Sold by
Swartz & Brough Inc
Bought by
Murphy William
Home Financials for this Owner
Home Financials are based on the most recent Mortgage that was taken out on this home.
Original Mortgage
$23,320
Interest Rate
6.13%
Mortgage Type
Purchase Money Mortgage
Create a Home Valuation Report for This Property
The Home Valuation Report is an in-depth analysis detailing your home's value as well as a comparison with similar homes in the area
Home Values in the Area
Average Home Value in this Area
Purchase History
| Date | Buyer | Sale Price | Title Company |
|---|---|---|---|
| Cordova Silvia Sanchez De | -- | Stewart Title Of Texarkana | |
| Sanchez Jose | -- | None Available | |
| Swartz & Brough Inc | $13,891 | None Available | |
| Murphy William | -- | None Available |
Source: Public Records
Mortgage History
| Date | Status | Borrower | Loan Amount |
|---|---|---|---|
| Open | Cordova Silvia Sanchez De | $19,000 | |
| Previous Owner | Murphy William | $23,320 |
Source: Public Records
Tax History Compared to Growth
Tax History
| Year | Tax Paid | Tax Assessment Tax Assessment Total Assessment is a certain percentage of the fair market value that is determined by local assessors to be the total taxable value of land and additions on the property. | Land | Improvement |
|---|---|---|---|---|
| 2025 | $592 | $25,768 | $2,000 | $23,768 |
| 2024 | $592 | $24,988 | $2,000 | $22,988 |
| 2023 | $558 | $23,545 | $2,000 | $21,545 |
| 2022 | $516 | $21,612 | $2,000 | $19,612 |
| 2021 | $514 | $20,116 | $2,000 | $18,116 |
| 2020 | $453 | $17,612 | $2,000 | $15,612 |
| 2019 | $460 | $17,259 | $2,000 | $15,259 |
| 2018 | $451 | $16,917 | $2,000 | $14,917 |
| 2017 | $444 | $16,694 | $2,000 | $14,694 |
| 2016 | $409 | $15,368 | $1,000 | $14,368 |
| 2015 | $316 | $12,210 | $1,000 | $11,210 |
| 2014 | $316 | $12,210 | $1,000 | $11,210 |
Source: Public Records
Map
Nearby Homes
- tbd Collum St
- 321 Reading St
- 2311 New Boston Rd
- 1010 Richmond Rd
- 1107 Wheeler St
- 2901 Marion St
- 2215 W 18th St
- 2010 W 18th St
- 2308 W 16th St
- 1609 Plum St
- 2109 W 17th St
- 1709 Plant
- 1800 Goree St
- 2211 N Akin Ave
- 2122 Taylor St
- 1124 Wheeler St
- 1406 Richmond Rd
- 2806 Lester St
- 2107 W 17th St
- 1705 W 15th St
- 514 Lumpkin St
- 512 Lumpkin St
- 602 Lumpkin St
- 515 Connella St
- 510 Lumpkin St
- 513 Connella St
- 515 Lumpkin St
- 513 Lumpkin St
- 511 Lumpkin St
- 511 Connella St
- 601 Lumpkin St
- 508 Lumpkin St
- 603 Lumpkin St
- 601 Connella St
- 603 Connella St
- 509 Lumpkin St
- 605 Connella St
- 608 Lumpkin St
- 507 Connella St
- 506 Lumpkin St