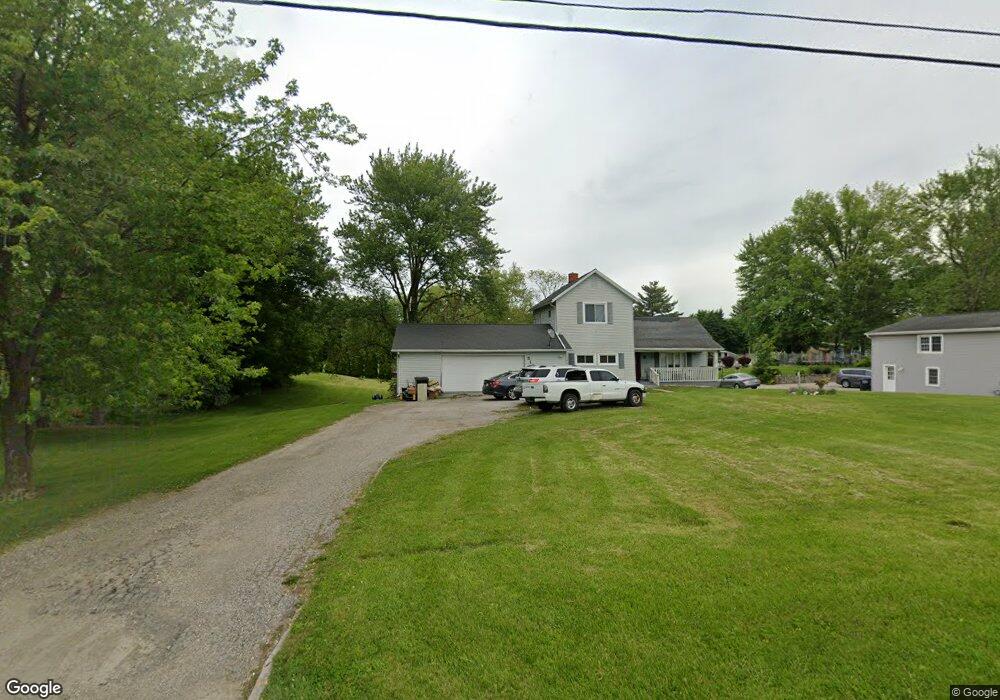
516 N Main St Antwerp, OH 45813
Estimated Value: $148,178 - $183,000
3
Beds
1
Bath
2,014
Sq Ft
$83/Sq Ft
Est. Value
About This Home
This home is located at 516 N Main St, Antwerp, OH 45813 and is currently estimated at $167,045, approximately $82 per square foot. 516 N Main St is a home located in Paulding County with nearby schools including Antwerp Local Elementary School and Antwerp Local High School.
Ownership History
Date
Name
Owned For
Owner Type
Purchase Details
Closed on
Jan 30, 2020
Sold by
Heitzmann Charles Eric
Bought by
Heitzmann Sarah and Gallaher Jerry
Current Estimated Value
Purchase Details
Closed on
Feb 4, 2008
Sold by
Radabaugh Sharyl
Bought by
Christiana Bank & Trust Co and The Security National Funding Trust
Purchase Details
Closed on
Nov 17, 2005
Sold by
Krohn David L and Krohn Sallie A
Bought by
Radabaugh Sharyl
Home Financials for this Owner
Home Financials are based on the most recent Mortgage that was taken out on this home.
Original Mortgage
$56,000
Interest Rate
8.25%
Mortgage Type
Adjustable Rate Mortgage/ARM
Purchase Details
Closed on
Jul 31, 2001
Sold by
Singer Bryan K
Bought by
Heitzmann Charles Eric
Create a Home Valuation Report for This Property
The Home Valuation Report is an in-depth analysis detailing your home's value as well as a comparison with similar homes in the area
Purchase History
| Date | Buyer | Sale Price | Title Company |
|---|---|---|---|
| Heitzmann Sarah | -- | Merestone Title Agency | |
| Christiana Bank & Trust Co | $40,000 | None Available | |
| Radabaugh Sharyl | $70,000 | None Available | |
| Krohn David | -- | None Available | |
| Heitzmann Charles Eric | $63,000 | -- |
Source: Public Records
Mortgage History
| Date | Status | Borrower | Loan Amount |
|---|---|---|---|
| Previous Owner | Radabaugh Sharyl | $56,000 |
Source: Public Records
Tax History
| Year | Tax Paid | Tax Assessment Tax Assessment Total Assessment is a certain percentage of the fair market value that is determined by local assessors to be the total taxable value of land and additions on the property. | Land | Improvement |
|---|---|---|---|---|
| 2025 | $2,087 | $51,170 | $17,710 | $33,460 |
| 2024 | $2,087 | $34,580 | $11,970 | $22,610 |
| 2023 | $1,568 | $34,580 | $11,970 | $22,610 |
| 2022 | $1,425 | $34,580 | $11,970 | $22,610 |
| 2021 | $1,340 | $29,050 | $11,970 | $17,080 |
| 2020 | $1,372 | $27,580 | $10,500 | $17,080 |
| 2019 | $1,317 | $26,040 | $10,500 | $15,540 |
| 2018 | $1,249 | $26,040 | $10,500 | $15,540 |
| 2017 | $1,250 | $25,760 | $10,500 | $15,260 |
| 2016 | $1,236 | $25,760 | $10,500 | $15,260 |
| 2015 | $1,217 | $25,450 | $10,500 | $14,950 |
| 2014 | $1,142 | $25,450 | $10,500 | $14,950 |
| 2013 | $1,288 | $26,220 | $10,500 | $15,720 |
Source: Public Records
Map
Nearby Homes
- 110 Wilcox St
- 136 Maumee Ln
- 314 E Canal St
- 214 Weber St
- 212 Weber St
- 210 Weber St
- 13149 Road 27b
- 3190 Road 204
- 16453 Road 63
- 4787 Carson Ct
- 25812 Maumee Center Rd
- 26100 Worden Rd
- 11309 State Route 49
- 4616 Homestead Trail
- 5038 Chickadee Dr
- 651 W High St
- 22108 State Road 37
- 4974 Chickadee Dr
- 22331 Maple Ln
- 22428 Ash St Unit 25
Your Personal Tour Guide
Ask me questions while you tour the home.