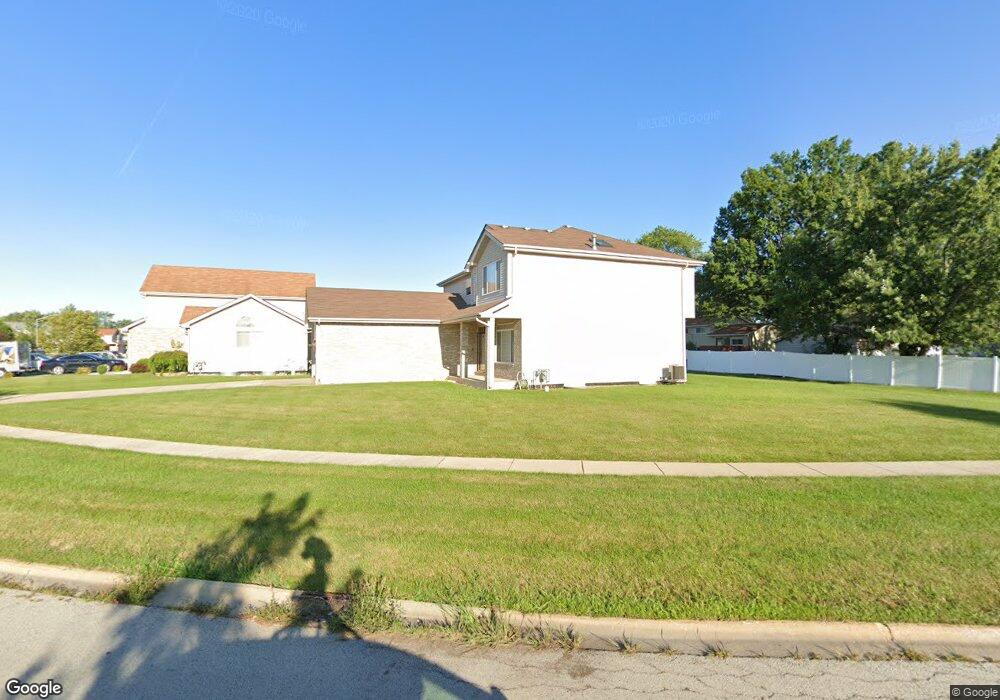
516 Regent Rd University Park, IL 60484
Estimated Value: $306,358 - $347,000
4
Beds
3
Baths
2,481
Sq Ft
$132/Sq Ft
Est. Value
About This Home
This home is located at 516 Regent Rd, University Park, IL 60484 and is currently estimated at $327,340, approximately $131 per square foot. 516 Regent Rd is a home located in Will County with nearby schools including Balmoral Elementary School, Crete-Monee Middle School, and Crete-Monee High School.
Ownership History
Date
Name
Owned For
Owner Type
Purchase Details
Closed on
Jan 3, 2020
Sold by
Hill Lashunda
Bought by
Hill Lashunda and Self Tommie L
Current Estimated Value
Purchase Details
Closed on
Jan 30, 2007
Sold by
Chicago Title Land Trust Co
Bought by
Hill Lashunda
Home Financials for this Owner
Home Financials are based on the most recent Mortgage that was taken out on this home.
Original Mortgage
$252,650
Outstanding Balance
$152,250
Interest Rate
6.27%
Mortgage Type
Purchase Money Mortgage
Estimated Equity
$175,090
Create a Home Valuation Report for This Property
The Home Valuation Report is an in-depth analysis detailing your home's value as well as a comparison with similar homes in the area
Home Values in the Area
Average Home Value in this Area
Purchase History
| Date | Buyer | Sale Price | Title Company |
|---|---|---|---|
| Hill Lashunda | -- | None Available | |
| Hill Lashunda | $253,000 | Chicago Title Insurance Co |
Source: Public Records
Mortgage History
| Date | Status | Borrower | Loan Amount |
|---|---|---|---|
| Open | Hill Lashunda | $252,650 |
Source: Public Records
Tax History Compared to Growth
Tax History
| Year | Tax Paid | Tax Assessment Tax Assessment Total Assessment is a certain percentage of the fair market value that is determined by local assessors to be the total taxable value of land and additions on the property. | Land | Improvement |
|---|---|---|---|---|
| 2024 | -- | $88,693 | $14,480 | $74,213 |
| 2023 | -- | $76,460 | $12,483 | $63,977 |
| 2022 | $0 | $67,259 | $10,981 | $56,278 |
| 2021 | $0 | $61,262 | $10,086 | $51,176 |
| 2020 | $593 | $58,068 | $9,759 | $48,309 |
| 2019 | $7,957 | $55,067 | $9,255 | $45,812 |
| 2018 | $8,072 | $54,783 | $9,069 | $45,714 |
| 2017 | $8,370 | $55,481 | $8,823 | $46,658 |
| 2016 | $8,275 | $54,836 | $8,500 | $46,336 |
| 2015 | $7,584 | $52,147 | $8,086 | $44,061 |
| 2014 | $7,584 | $51,427 | $7,974 | $43,453 |
| 2013 | $7,584 | $53,850 | $8,350 | $45,500 |
Source: Public Records
Map
Nearby Homes