516 Ryland St Unit 1 Reno, NV 89502
MidTown NeighborhoodEstimated Value: $636,922
2
Beds
1
Bath
1,084
Sq Ft
$588/Sq Ft
Est. Value
About This Home
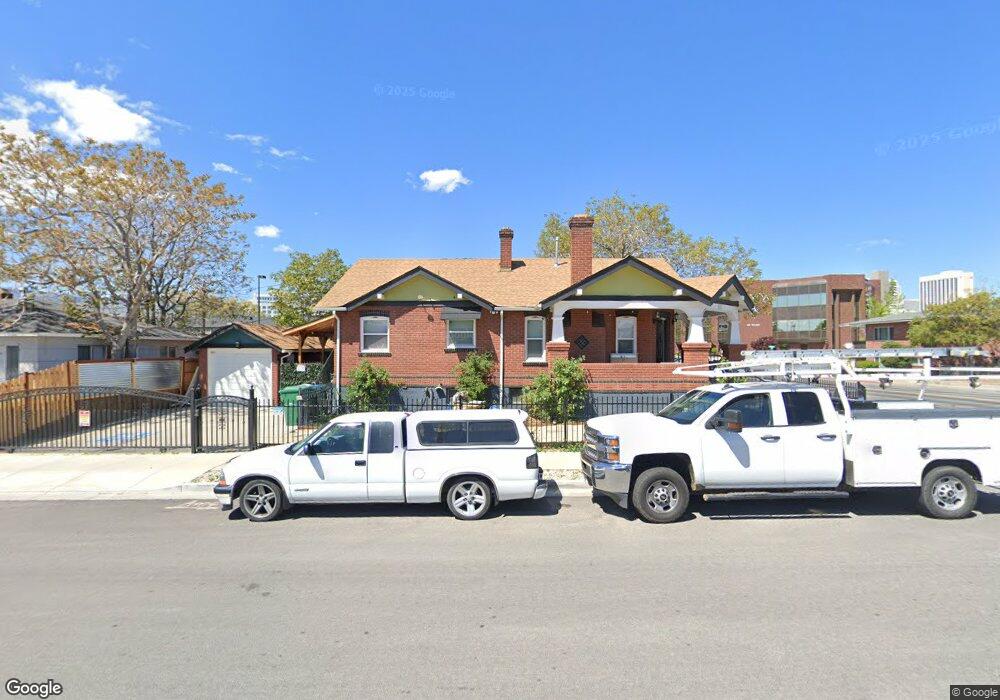
This home is located at 516 Ryland St Unit 1, Reno, NV 89502 and is currently estimated at $636,922, approximately $587 per square foot. 516 Ryland St Unit 1 is a home located in Washoe County with nearby schools including Libby C Booth Elementary School, Vaughn Middle School, and Earl Wooster High School.
Ownership History
Date
Name
Owned For
Owner Type
Purchase Details
Closed on
Mar 22, 2024
Sold by
Nvison Insurance Agency Inc
Bought by
Tirado Jaime Lopez and De Lopez Elisabeth
Current Estimated Value
Home Financials for this Owner
Home Financials are based on the most recent Mortgage that was taken out on this home.
Original Mortgage
$374,000
Outstanding Balance
$367,941
Interest Rate
6.77%
Mortgage Type
New Conventional
Estimated Equity
$268,981
Purchase Details
Closed on
Apr 26, 2017
Sold by
Drobissh Hilts Christina
Bought by
Nvision Insurance Agency Inc
Purchase Details
Closed on
Mar 25, 2004
Sold by
Anastassatos Chris A and Anastassatos Pamela G
Bought by
Drobish Christina
Home Financials for this Owner
Home Financials are based on the most recent Mortgage that was taken out on this home.
Original Mortgage
$120,000
Interest Rate
5.37%
Mortgage Type
Unknown
Create a Home Valuation Report for This Property
The Home Valuation Report is an in-depth analysis detailing your home's value as well as a comparison with similar homes in the area
Home Values in the Area
Average Home Value in this Area
Purchase History
| Date | Buyer | Sale Price | Title Company |
|---|---|---|---|
| Tirado Jaime Lopez | $574,500 | First American Title | |
| Nvision Insurance Agency Inc | $310,000 | Ticor Title Las Vegas | |
| Drobish Hilts Christina | -- | Ticor Title Reno | |
| Drobish Christina | $150,000 | Western Title Incorporated |
Source: Public Records
Mortgage History
| Date | Status | Borrower | Loan Amount |
|---|---|---|---|
| Open | Tirado Jaime Lopez | $374,000 | |
| Previous Owner | Drobish Christina | $120,000 | |
| Closed | Drobish Christina | $30,000 |
Source: Public Records
Tax History Compared to Growth
Tax History
| Year | Tax Paid | Tax Assessment Tax Assessment Total Assessment is a certain percentage of the fair market value that is determined by local assessors to be the total taxable value of land and additions on the property. | Land | Improvement |
|---|---|---|---|---|
| 2025 | $1,915 | $64,315 | $33,874 | $30,441 |
| 2024 | $1,915 | $62,675 | $32,334 | $30,341 |
| 2023 | $1,776 | $58,630 | $30,794 | $27,835 |
| 2022 | $1,648 | $47,940 | $24,635 | $23,304 |
| 2021 | $1,527 | $42,270 | $20,017 | $22,253 |
| 2020 | $1,435 | $42,327 | $20,017 | $22,310 |
| 2019 | $1,378 | $37,521 | $16,231 | $21,290 |
| 2018 | $1,319 | $35,134 | $14,820 | $20,314 |
| 2017 | $1,222 | $32,958 | $14,467 | $18,491 |
| 2016 | $1,191 | $32,307 | $14,114 | $18,193 |
| 2015 | $1,190 | $32,113 | $14,114 | $17,999 |
| 2014 | $1,163 | $31,364 | $14,114 | $17,250 |
| 2013 | -- | $30,856 | $14,114 | $16,742 |
Source: Public Records
Map
Nearby Homes
- 514 Ryland St
- 319 Wheeler Ave
- 302 Wheeler Ave
- 320 High St
- 318 Wheeler Ave
- 318 Wheeler Ave Unit Upper
- 327 Wheeler Ave
- 504 High St
- 509 Ryland St
- 612 Ryland St
- 337 Wheeler Ave Unit 1
- 337 Wheeler Ave
- 328 Wheeler Ave
- 620 Ryland St
- 622.5 Ryland St
- 622 Ryland St
- 1 Ryland St
- 331 Wheeler Ave
- 229 S Park St
- 338 Wheeler Ave Unit 8