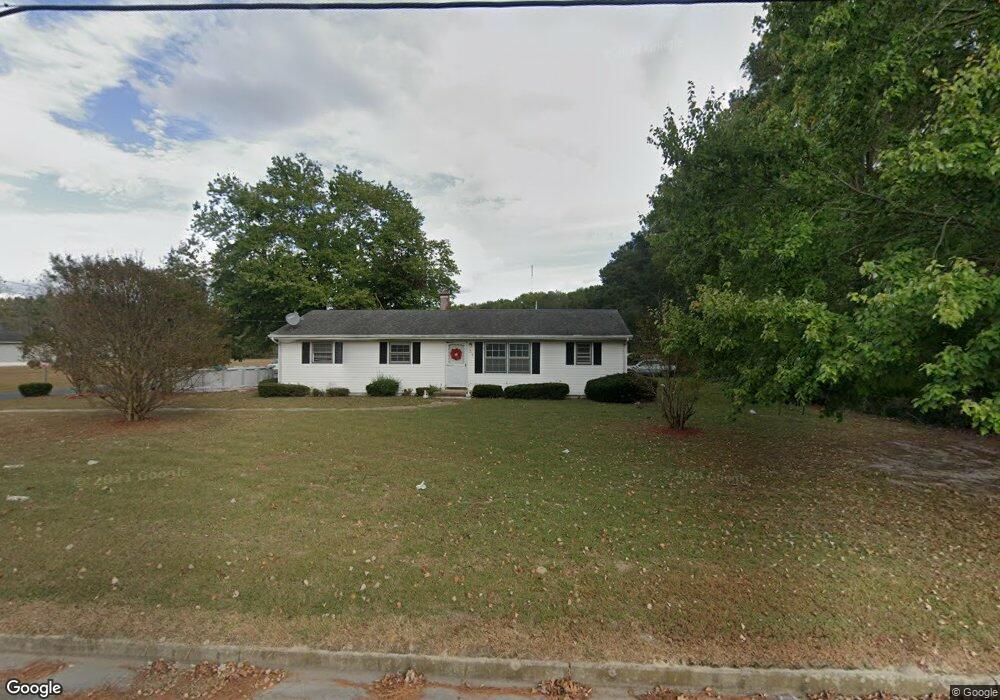
516 S Curlew Rd Salisbury, MD 21801
North Salisbury NeighborhoodEstimated Value: $163,184 - $205,000
--
Bed
1
Bath
1,248
Sq Ft
$150/Sq Ft
Est. Value
About This Home
This home is located at 516 S Curlew Rd, Salisbury, MD 21801 and is currently estimated at $187,796, approximately $150 per square foot. 516 S Curlew Rd is a home located in Wicomico County with nearby schools including West Salisbury Elementary School, North Salisbury Elementary School, and Salisbury Middle School.
Ownership History
Date
Name
Owned For
Owner Type
Purchase Details
Closed on
Mar 29, 2022
Sold by
Matthews Sr Walter L
Bought by
Joo Kyu Wan
Current Estimated Value
Purchase Details
Closed on
Jun 23, 2020
Sold by
Matthews Walter L and Matthews Martha L
Bought by
Matthews Walter L
Purchase Details
Closed on
Aug 16, 2006
Sold by
Dorman Mary Louise L and Dorman E
Bought by
Dorman Mary Louise and Matthews Martha L
Purchase Details
Closed on
Aug 3, 2006
Sold by
Dorman Mary Louise L and Dorman E
Bought by
Dorman Mary Louise and Matthews Martha L
Purchase Details
Closed on
Apr 4, 2005
Sold by
Dorman Mary Louise
Bought by
Dorman Mary Louise and Matthews Walter L
Purchase Details
Closed on
Jan 21, 2005
Sold by
Long Bertha
Bought by
Dorman Mary Louise
Home Financials for this Owner
Home Financials are based on the most recent Mortgage that was taken out on this home.
Original Mortgage
$37,800
Interest Rate
7.75%
Mortgage Type
Adjustable Rate Mortgage/ARM
Create a Home Valuation Report for This Property
The Home Valuation Report is an in-depth analysis detailing your home's value as well as a comparison with similar homes in the area
Home Values in the Area
Average Home Value in this Area
Purchase History
| Date | Buyer | Sale Price | Title Company |
|---|---|---|---|
| Joo Kyu Wan | $37,000 | Cockey Brennan & Maloney Pc | |
| Matthews Walter L | -- | None Available | |
| Dorman Mary Louise | -- | -- | |
| Dorman Mary Louise | -- | -- | |
| Dorman Mary Louise | $38,000 | -- | |
| Dorman Mary Louise | -- | -- |
Source: Public Records
Mortgage History
| Date | Status | Borrower | Loan Amount |
|---|---|---|---|
| Previous Owner | Dorman Mary Louise | $37,800 |
Source: Public Records
Tax History Compared to Growth
Tax History
| Year | Tax Paid | Tax Assessment Tax Assessment Total Assessment is a certain percentage of the fair market value that is determined by local assessors to be the total taxable value of land and additions on the property. | Land | Improvement |
|---|---|---|---|---|
| 2025 | $1,282 | $138,667 | $0 | $0 |
| 2024 | $1,282 | $127,433 | $0 | $0 |
| 2023 | $158 | $15,800 | $14,800 | $1,000 |
| 2022 | $221 | $15,800 | $14,800 | $1,000 |
| 2021 | $832 | $75,533 | $0 | $0 |
| 2020 | $800 | $71,800 | $14,800 | $57,000 |
| 2019 | $715 | $68,333 | $0 | $0 |
| 2018 | $706 | $64,867 | $0 | $0 |
| 2017 | $713 | $61,400 | $0 | $0 |
| 2016 | -- | $61,400 | $0 | $0 |
| 2015 | $961 | $61,400 | $0 | $0 |
| 2014 | $961 | $73,800 | $0 | $0 |
Source: Public Records
Map
Nearby Homes
- 504 Swan Rd
- 29015 Adventist Dr
- 29007 Adventist Dr
- 516 Overbrook Dr
- 650 Suffolk Ct
- 0 Queen Ave Unit MDWC2006982
- 902 Lake St
- 0 Morris St
- 1201 Kiowa Ave
- 313 W London Ave
- 309 W London Ave
- 516 Purnell St
- 304 Brooklyn Ave
- 830 Mersey Ln
- 834 Mersey Ln
- 1107 Mineola Ave
- 311 W Philadelphia Ave
- JEFFERSON Plan at Sassafras Meadows
- 1606 Towson Ave
- 731 N Westover Dr
- 514 S Curlew Rd
- 1202 Jersey Rd
- 1205 Jersey Rd
- 512 S Curlew Rd
- 508 S Curlew Rd
- 1213 Jersey Rd
- 524 N Curlew Rd
- 506 S Curlew Rd
- 503 S Curlew Rd
- 1200 Jersey Rd
- 518 N Curlew Rd
- 1220 Jersey Rd
- 535 N Curlew Rd
- 533 N Curlew Rd
- 527 N Curlew Rd
- 501 S Curlew Rd
- 510 N Curlew Rd
- 521 N Curlew Rd
- 1222 Jersey Rd
- 1216 Jersey Rd