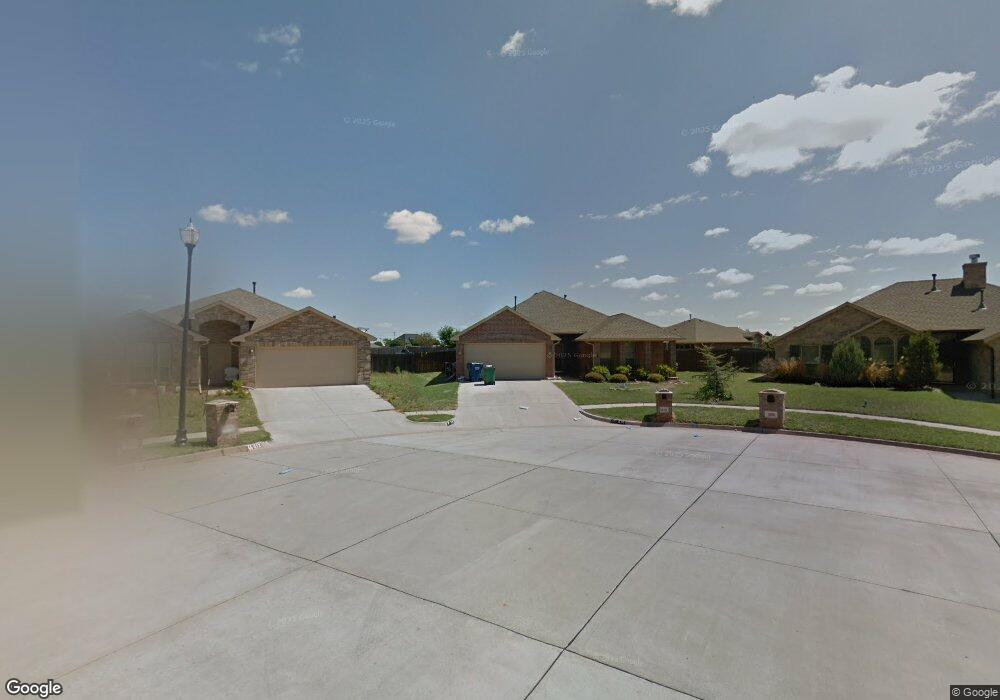
516 S Hillcrest Court Ln Mustang, OK 73064
Estimated Value: $258,000 - $276,000
3
Beds
2
Baths
1,827
Sq Ft
$145/Sq Ft
Est. Value
About This Home
This home is located at 516 S Hillcrest Court Ln, Mustang, OK 73064 and is currently estimated at $265,320, approximately $145 per square foot. 516 S Hillcrest Court Ln is a home located in Canadian County with nearby schools including Mustang Elementary School, Mustang Horizon Intermediate School, and Mustang Middle School.
Ownership History
Date
Name
Owned For
Owner Type
Purchase Details
Closed on
Dec 30, 2016
Sold by
Hartman Morgan and Hartman Morgan Leigh
Bought by
Hartman Morgan L
Current Estimated Value
Home Financials for this Owner
Home Financials are based on the most recent Mortgage that was taken out on this home.
Original Mortgage
$125,000
Outstanding Balance
$102,746
Interest Rate
4.03%
Estimated Equity
$162,574
Purchase Details
Closed on
Jul 27, 2012
Sold by
Gerten Michael Douglas and Gerten Julie Gail
Bought by
Hartman Tyler Lynn and Hartman Morgan Leigh
Purchase Details
Closed on
Feb 20, 2008
Sold by
D R Horton Texas Ltd Lp
Bought by
Hartman Tyler and Hartman Morgan
Home Financials for this Owner
Home Financials are based on the most recent Mortgage that was taken out on this home.
Original Mortgage
$128,180
Interest Rate
5.68%
Mortgage Type
New Conventional
Create a Home Valuation Report for This Property
The Home Valuation Report is an in-depth analysis detailing your home's value as well as a comparison with similar homes in the area
Home Values in the Area
Average Home Value in this Area
Purchase History
| Date | Buyer | Sale Price | Title Company |
|---|---|---|---|
| Hartman Morgan L | -- | Old Republic Title | |
| Hartman Tyler Lynn | $140,000 | Ort | |
| Hartman Tyler | $160,500 | Lawyers Title Of Ok City Inc |
Source: Public Records
Mortgage History
| Date | Status | Borrower | Loan Amount |
|---|---|---|---|
| Open | Hartman Morgan L | $125,000 | |
| Previous Owner | Hartman Tyler | $128,180 |
Source: Public Records
Tax History Compared to Growth
Tax History
| Year | Tax Paid | Tax Assessment Tax Assessment Total Assessment is a certain percentage of the fair market value that is determined by local assessors to be the total taxable value of land and additions on the property. | Land | Improvement |
|---|---|---|---|---|
| 2024 | $2,391 | $25,165 | $2,940 | $22,225 |
| 2023 | $2,391 | $23,967 | $2,940 | $21,027 |
| 2022 | $2,305 | $22,826 | $2,940 | $19,886 |
| 2021 | $2,204 | $21,739 | $2,940 | $18,799 |
| 2020 | $2,123 | $20,813 | $2,940 | $17,873 |
| 2019 | $2,022 | $19,822 | $2,940 | $16,882 |
| 2018 | $1,968 | $18,878 | $2,940 | $15,938 |
| 2017 | $1,945 | $18,878 | $2,940 | $15,938 |
| 2016 | $1,859 | $19,571 | $2,940 | $16,631 |
| 2015 | $1,774 | $18,447 | $2,940 | $15,507 |
| 2014 | $1,774 | $18,084 | $2,940 | $15,144 |
Source: Public Records
Map
Nearby Homes
- 720 E Linden Ln
- 1009 S Blackjack Ln
- 531 E Juniper Ln
- 427 S Castlerock Circle Ln
- 421 E Hillcrest Ln
- Belmore Plus Plan at Wild Horse Canyon
- Duxbury Plan at Wild Horse Canyon
- Charlotte Plan at Wild Horse Canyon
- Bristol Plan at Wild Horse Canyon
- Belmore Plan at Wild Horse Canyon
- Ashton Plan at Wild Horse Canyon
- Abingdon Plan at Wild Horse Canyon
- 1017 S Appaloosa Ln
- 1204 E Stetson Ln
- 1121 E Stetson Ln
- 1117 E Stetson Ln
- 1237 E Stetson Ln
- 1232 E Stetson Ln
- 1029 S Appaloosa Ln
- 1005 S Colt Ln
- 512 S Hillcrest Court Ln
- 520 S Hillcrest Court Ln
- 515 S Kaylee Ln
- 511 S Hillcrest Court Ln
- 600 S Hillcrest Court Ln
- 519 S Kaylee Ln
- 511 S Kaylee Ln
- 515 S Hillcrest Court Ln
- 601 S Kaylee Ln
- 720 E Forest Court Ln
- 604 S Hillcrest Court Ln
- 519 S Hillcrest Court Ln
- 601 S Hillcrest Court Ln
- 605 S Kaylee Ln
- 512 S Kaylee Ln
- 712 E Forest Court Ln
- 605 S Hillcrest Court Ln
- 708 E Forest Court Ln
- 516 S Pointe Ln
- 520 S Pointe Ln