NOT LISTED FOR SALE

516 S Pelham St Rhinelander, WI 54501

Estimated Value: $126,000 - $186,000

3 Beds
2 Baths
1,150 Sq Ft
$134/Sq Ft Est. Value

Last Sold January 15, 2014

Last sale price $55,000 $48 Per Sq Ft

Est. 179% increase in value since last sale

Current estimated payment $942/month

About This Home

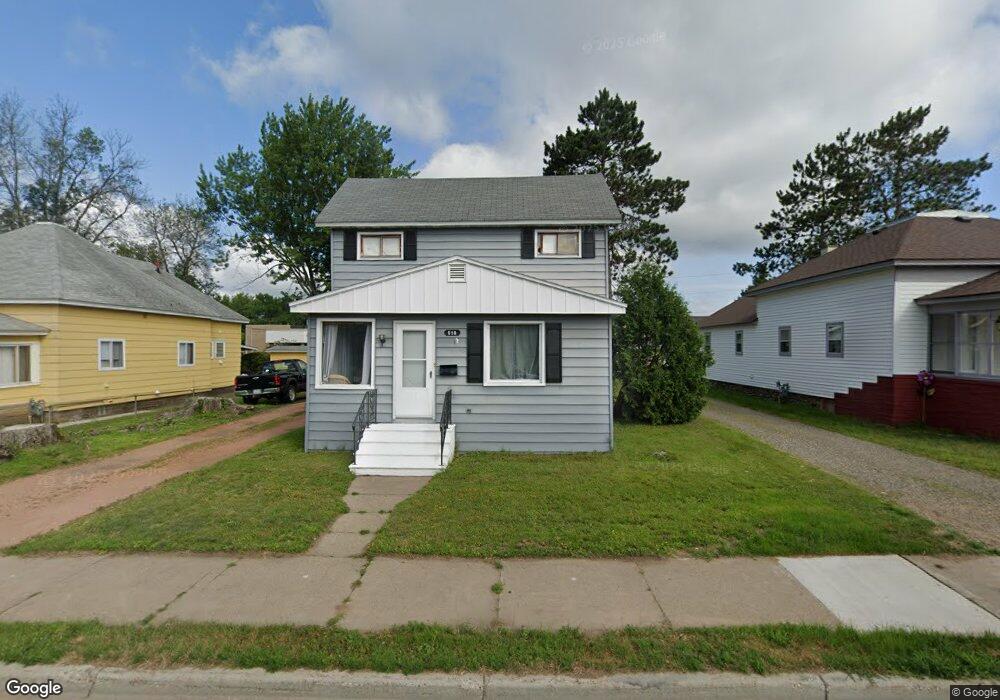
This 3 bedroom, 2 bath home features newer furnace, central air, and many recent updates including brand new main floor bath and new flooring throughout the main level. Home features a first floor master bedroom, and two additional bedrooms upstairs. Plenty of room throughout. Ample storage in detached two car garage. Directly across the street from South Park School!

Ownership History

Date Name Owned For Owner Type

Purchase Details

Listed on
Jul 25, 2013
Closed on
Jan 15, 2014
Sold by
Elizabeth A Elizabeth A
Bought by
Meinert Eric and Meinert Jessica
Seller's Agent
Kathy Dolch
PINE POINT REALTY
Buyer's Agent
JON KOCH
PINE POINT REALTY
List Price
$70,000
Sold Price
$55,000
Premium/Discount to List
-$15,000
-21.43%
Current Estimated Value
$153,672

Home Financials for this Owner

Home Financials are based on the most recent Mortgage that was taken out on this home.
Estimated Appreciation
$98,672
Avg. Annual Appreciation
9.11%
Original Mortgage
$56,122
Outstanding Balance
$42,547
Interest Rate
4.5%
Mortgage Type
New Conventional
Estimated Equity
$111,125
Source: Public Records

Range of Values:

Collateral Analytics

Collateral Analytics Collateral Analytics AVMs (Automated Valuation Model) employ a number of statistical approaches combined with neighborhood-specific comparable selection guarantees the most up-to-date and precise valuations.

Not Available

Collateral Analytics does not have data for the current month. Please view the chart for historical values.

ICE

ICE Mortgage Technology ICE Mortgage Technology’s AVM (Automated Valuation Model) is a state-of-the-art online residential property valuation tool that provides a quick and accurate estimate of the value of almost any home in the U.S.

Not Available

ICE Mortgage Technology does not have data for the current month. Please view the chart for historical values.

First American

First American First American Data & Analytics’ next-generation AVM combines unrivaled data assets with a blended ensemble of valuation models to produce highly accurate, reliable valuations you can trust.

Not Available

First American does not have data for the current month. Please view the chart for historical values.

Quantarium

Quantarium Quantarium’s valuation service, repeatedly proven the industry’s most accurate and comprehensive, is supercharged with a self-learning and auto-tuning AI engine that continually becomes smarter and more accurate as it processes daily inputs from the industry’s leading RE data lake.

Not Available

Quantarium does not have data for the current month. Please view the chart for historical values.

Average Value
Not Available
List Price
Sold Price
Create a Home Valuation Report for This Property
The Home Valuation Report is an in-depth analysis detailing your home's value as well as a comparison with similar homes in the area

Home Values in the Area

Source: Public Records

Average Home Value in this Area


Source: Public Records

Purchase History

Date Buyer Sale Price Title Company
Meinert Eric $55,000 Northern Title
Source: Public Records

Mortgage History

Date Status Borrower Loan Amount
Open Meinert Eric $56,122
Source: Public Records

Property History

Date Event Price List to Sale Price per Sq Ft Prior Sale
01/15/2014 01/15/14 Sold $55,000 -21.4% $48 / Sq Ft View Prior Sale
12/20/2013 12/20/13 Pending -- -- --
07/25/2013 07/25/13 For Sale $70,000 -- $61 / Sq Ft

Tax History Compared to Growth

Source: Public Records

Tax History

Year Tax Paid Tax Assessment Tax Assessment Total Assessment is a certain percentage of the fair market value that is determined by local assessors to be the total taxable value of land and additions on the property. Land Improvement
2024 $1,640 $67,000 $8,600 $58,400
2023 $1,580 $67,000 $8,600 $58,400
2022 $2,094 $67,000 $8,600 $58,400
2021 $1,565 $67,000 $8,600 $58,400
2020 $2,673 $67,000 $8,600 $58,400
2019 $2,799 $67,000 $8,600 $58,400
2018 $2,805 $67,000 $8,600 $58,400
2017 $2,482 $67,000 $8,600 $58,400
2016 $2,376 $67,000 $8,600 $58,400
2015 $2,051 $76,900 $8,600 $68,300
2014 $2,051 $76,900 $8,600 $68,300
2011 $1,885 $85,200 $8,600 $76,600
Source: Public Records

Agents Affiliated with this Home

  • Section Image
See All Agents

Map