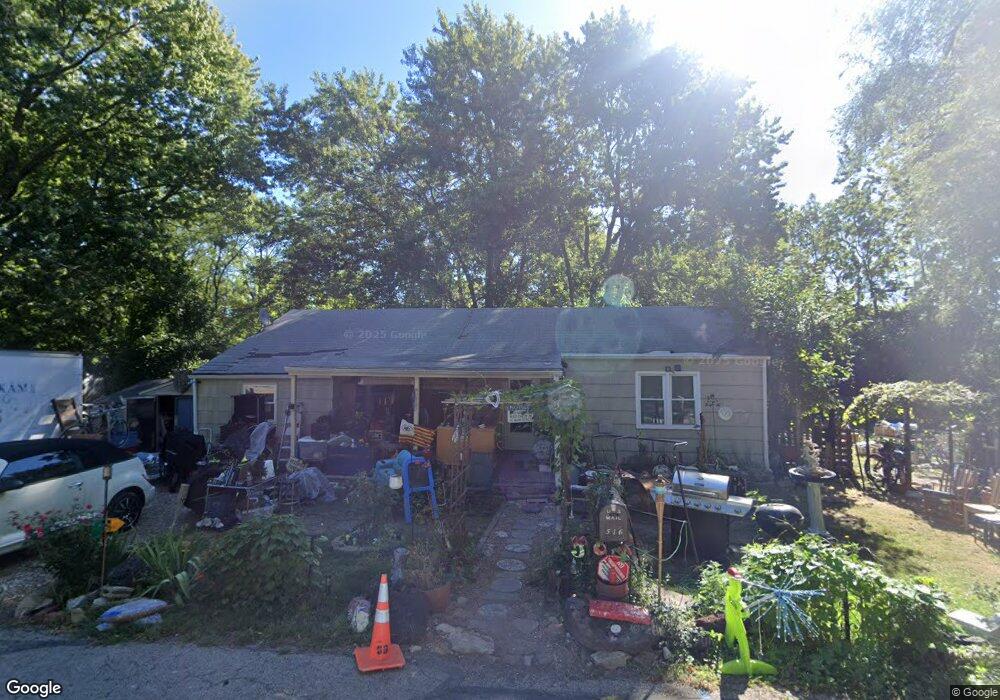
516 SW 12th St Blue Springs, MO 64015
Estimated Value: $168,276 - $225,000
2
Beds
1
Bath
1,228
Sq Ft
$155/Sq Ft
Est. Value
About This Home
This home is located at 516 SW 12th St, Blue Springs, MO 64015 and is currently estimated at $190,069, approximately $154 per square foot. 516 SW 12th St is a home located in Jackson County with nearby schools including Thomas J. Ultican Elementary School, Paul Kinder Middle School, and Blue Springs High School.
Ownership History
Date
Name
Owned For
Owner Type
Purchase Details
Closed on
Sep 10, 2015
Sold by
Scharfenkamp Leo J and Scharfenkamp Carlentina
Bought by
Scharfenkamp Derrick W and Mitchem Mary
Current Estimated Value
Purchase Details
Closed on
Aug 6, 2012
Sold by
Scharfenkamp Derrick W
Bought by
Scharfenkamp Carlentina
Purchase Details
Closed on
Jan 2, 2008
Sold by
Beneficial Mortgage Co Of Missouri
Bought by
Scharfenkamp Derrick
Purchase Details
Closed on
May 14, 2007
Sold by
Roth Donald L and Roth Michele L
Bought by
Beneficial Mortgage Co Missouri Inc
Purchase Details
Closed on
Nov 5, 1996
Sold by
Stevens Salvador G and Stevens Stacy Lynn
Bought by
Roth Donald L and Roth Michele L
Home Financials for this Owner
Home Financials are based on the most recent Mortgage that was taken out on this home.
Original Mortgage
$55,700
Interest Rate
8.17%
Mortgage Type
FHA
Create a Home Valuation Report for This Property
The Home Valuation Report is an in-depth analysis detailing your home's value as well as a comparison with similar homes in the area
Home Values in the Area
Average Home Value in this Area
Purchase History
| Date | Buyer | Sale Price | Title Company |
|---|---|---|---|
| Scharfenkamp Derrick W | -- | None Available | |
| Scharfenkamp Carlentina | -- | None Available | |
| Scharfenkamp Derrick | -- | Multiple | |
| Beneficial Mortgage Co Missouri Inc | -- | None Available | |
| Roth Donald L | -- | -- |
Source: Public Records
Mortgage History
| Date | Status | Borrower | Loan Amount |
|---|---|---|---|
| Previous Owner | Roth Donald L | $55,700 |
Source: Public Records
Tax History Compared to Growth
Tax History
| Year | Tax Paid | Tax Assessment Tax Assessment Total Assessment is a certain percentage of the fair market value that is determined by local assessors to be the total taxable value of land and additions on the property. | Land | Improvement |
|---|---|---|---|---|
| 2025 | $1,434 | $20,210 | $4,201 | $16,009 |
| 2024 | $2,182 | $17,575 | $2,945 | $14,630 |
| 2023 | $2,182 | $27,265 | $2,945 | $24,320 |
| 2022 | $1,445 | $15,960 | $3,686 | $12,274 |
| 2021 | $1,444 | $15,960 | $3,686 | $12,274 |
| 2020 | $1,347 | $15,147 | $3,686 | $11,461 |
| 2019 | $1,302 | $15,147 | $3,686 | $11,461 |
| 2018 | $1,159 | $12,979 | $2,370 | $10,609 |
| 2017 | $1,005 | $12,979 | $2,370 | $10,609 |
| 2016 | $1,005 | $11,286 | $1,938 | $9,348 |
| 2014 | $849 | $9,500 | $3,056 | $6,444 |
Source: Public Records
Map
Nearby Homes
- 510 SW 12 St
- 514 SW 15 St
- 514 SW 10th St
- 318 SW 10th St
- 404 SW 9th St
- 1700 SW Mc Arthur St
- 701 SW 17th St
- 505 SW 18th St
- 304 SW 7th Street Terrace
- 152 SW 8th St
- 521 SW Moore St
- 1008 SW 17th St
- 1013 SW 16th St
- 2000 SW Smith St
- 804 NW North Summit Cir
- 500 W Walnut St
- 1301 SW Sunrise Dr
- 1331 SW Horizon Dr
- 1109 NW B St
- 503 NW 15th St
- 514 SW 12th St
- 512 SW 12th St
- 1203 SW South Ave
- 512 SW 12th St
- 1116 SW South Ave
- 513 SW 12th St
- 1202 SW South Ave Unit A
- 1202 SW South Ave
- 1205 SW South Ave
- 515 SW 12th St
- 510 SW 12th St
- 1204 SW South Ave Unit A
- 1204 SW South Ave
- 1209 SW South Ave
- 511 SW 12th St
- 1208 SW South Ave
- 509 SW 10th St
- 507 SW 12th St
- 511 SW 10th St
- 518 SW 13th St