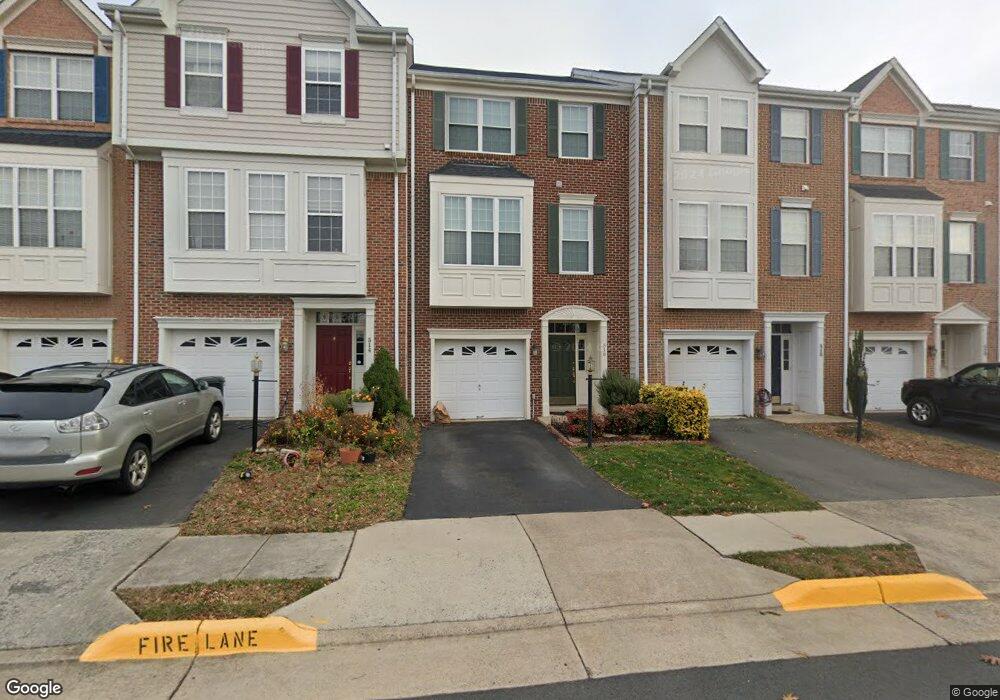
516 Twintree Terrace NE Leesburg, VA 20176
Estimated Value: $580,344 - $607,000
3
Beds
3
Baths
1,684
Sq Ft
$353/Sq Ft
Est. Value
About This Home
This home is located at 516 Twintree Terrace NE, Leesburg, VA 20176 and is currently estimated at $594,086, approximately $352 per square foot. 516 Twintree Terrace NE is a home located in Loudoun County with nearby schools including Frederick Douglass Elementary School, Harper Park Middle School, and Heritage High School.
Ownership History
Date
Name
Owned For
Owner Type
Purchase Details
Closed on
Nov 24, 2004
Sold by
Fuller Brenda M
Bought by
Popp Richard A
Current Estimated Value
Home Financials for this Owner
Home Financials are based on the most recent Mortgage that was taken out on this home.
Original Mortgage
$320,000
Outstanding Balance
$160,470
Interest Rate
5.75%
Mortgage Type
New Conventional
Estimated Equity
$433,616
Purchase Details
Closed on
Sep 30, 2004
Sold by
Drees Co
Bought by
Fuller Brenda M
Home Financials for this Owner
Home Financials are based on the most recent Mortgage that was taken out on this home.
Original Mortgage
$320,000
Outstanding Balance
$160,470
Interest Rate
5.75%
Mortgage Type
New Conventional
Estimated Equity
$433,616
Create a Home Valuation Report for This Property
The Home Valuation Report is an in-depth analysis detailing your home's value as well as a comparison with similar homes in the area
Home Values in the Area
Average Home Value in this Area
Purchase History
| Date | Buyer | Sale Price | Title Company |
|---|---|---|---|
| Popp Richard A | $400,000 | -- | |
| Popp Richard A | $400,000 | -- | |
| Fuller Brenda M | $310,915 | -- |
Source: Public Records
Mortgage History
| Date | Status | Borrower | Loan Amount |
|---|---|---|---|
| Open | Popp Richard A | $320,000 | |
| Closed | Popp Richard A | $320,000 | |
| Previous Owner | Fuller Brenda M | $279,800 |
Source: Public Records
Tax History Compared to Growth
Tax History
| Year | Tax Paid | Tax Assessment Tax Assessment Total Assessment is a certain percentage of the fair market value that is determined by local assessors to be the total taxable value of land and additions on the property. | Land | Improvement |
|---|---|---|---|---|
| 2025 | $4,603 | $571,750 | $160,000 | $411,750 |
| 2024 | $4,603 | $532,150 | $160,000 | $372,150 |
| 2023 | $4,540 | $518,820 | $160,000 | $358,820 |
| 2022 | $4,300 | $483,180 | $125,000 | $358,180 |
| 2021 | $4,381 | $447,070 | $120,000 | $327,070 |
| 2020 | $4,240 | $409,670 | $120,000 | $289,670 |
| 2019 | $4,105 | $392,780 | $120,000 | $272,780 |
| 2018 | $4,061 | $374,240 | $120,000 | $254,240 |
| 2017 | $4,077 | $362,360 | $120,000 | $242,360 |
| 2016 | $4,095 | $357,640 | $0 | $0 |
| 2015 | $656 | $238,350 | $0 | $238,350 |
| 2014 | $639 | $259,220 | $0 | $259,220 |
Source: Public Records
Map
Nearby Homes
- 561 Edmonton Terrace NE
- 577 Edmonton Terrace NE
- 700 Mount Airy Terrace NE Unit 403
- 700 Mount Airy Terrace NE Unit 405
- 750 Mount Airy Terrace NE Unit 403
- 750 Mount Airy Terrace NE Unit 206
- 750 Mount Airy Terrace NE Unit 205
- 750 Mount Airy Terrace NE Unit 304
- 18474 Sierra Springs Square
- 42718 Cannon Chapel Dr
- 42722 Cannon Chapel Dr
- 42704 Cattail Creek Dr
- 42726 Cannon Chapel Dr
- 42708 Cattail Creek Dr
- 42735 Cannon Chapel Dr
- 42635 Daybreak Meadow Dr
- 42725 Kula Pond Dr
- 42639 Daybreak Meadow Dr
- 42729 Kula Pond Dr
- 1007 Inferno Terrace SE
- 514 Twintree Terrace NE
- 518 Twintree Terrace NE
- 520 Twintree Terrace NE
- 512 Twintree Terrace NE
- 522 Twintree Terrace NE
- 510 Twintree Terrace NE
- 524 Twintree Terrace NE
- 508 Twintree Terrace NE
- 526 Twintree Terrace NE
- 506 Twintree Terrace NE
- 504 Twintree Terrace NE
- 535 Mcarthur Terrace NE
- 537 Mcarthur Terrace NE
- 502 Twintree Terrace NE
- 539 Mcarthur Terrace NE
- 503 Edmonton Terrace NE
- 501 Edmonton Terrace NE
- 505 Edmonton Terrace NE
- 507 Edmonton Terrace NE
- 541 Mcarthur Terrace NE