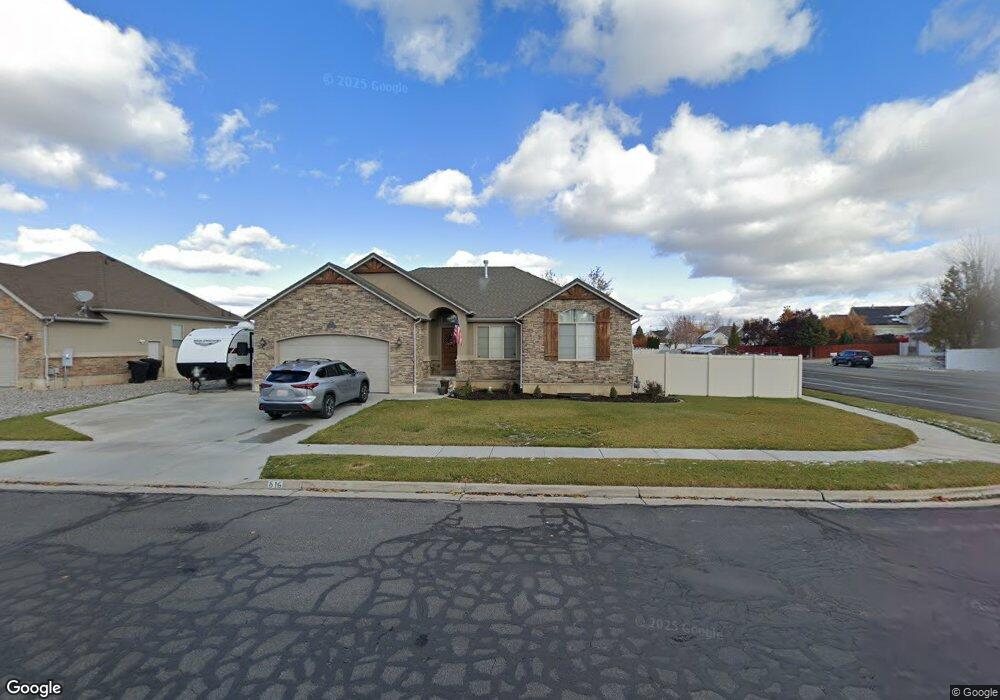
516 W 2920 S Syracuse, UT 84075
Estimated Value: $636,000 - $666,000
6
Beds
3
Baths
3,106
Sq Ft
$209/Sq Ft
Est. Value
About This Home
This home is located at 516 W 2920 S, Syracuse, UT 84075 and is currently estimated at $647,689, approximately $208 per square foot. 516 W 2920 S is a home located in Davis County with nearby schools including Bluff Ridge Elementary, Legacy Junior High School, and Clearfield High School.
Ownership History
Date
Name
Owned For
Owner Type
Purchase Details
Closed on
Nov 4, 2021
Sold by
Yarbrough Sam and Yarbrough Penelope
Bought by
Sakahara Timothy Michael and Sakahara Xuan
Current Estimated Value
Home Financials for this Owner
Home Financials are based on the most recent Mortgage that was taken out on this home.
Original Mortgage
$490,000
Outstanding Balance
$448,689
Interest Rate
3.09%
Estimated Equity
$199,000
Purchase Details
Closed on
Jan 14, 2013
Sold by
National Residential Nominee Services In
Bought by
Yarbrough Sam and Yarbrough Penelope
Home Financials for this Owner
Home Financials are based on the most recent Mortgage that was taken out on this home.
Original Mortgage
$210,400
Interest Rate
3.28%
Mortgage Type
New Conventional
Purchase Details
Closed on
Jun 1, 2012
Sold by
National Residential Nominee Services In
Bought by
Antonio San
Home Financials for this Owner
Home Financials are based on the most recent Mortgage that was taken out on this home.
Original Mortgage
$210,400
Interest Rate
3.28%
Mortgage Type
New Conventional
Purchase Details
Closed on
Jun 29, 2006
Sold by
Destination Homes Inc
Bought by
Foot Lindsay J
Home Financials for this Owner
Home Financials are based on the most recent Mortgage that was taken out on this home.
Original Mortgage
$209,170
Interest Rate
6.57%
Mortgage Type
Purchase Money Mortgage
Purchase Details
Closed on
Nov 7, 2005
Sold by
Discovery Development Llc
Bought by
Destination Homes Inc
Home Financials for this Owner
Home Financials are based on the most recent Mortgage that was taken out on this home.
Original Mortgage
$200,800
Interest Rate
5.9%
Mortgage Type
Purchase Money Mortgage
Purchase Details
Closed on
Oct 28, 2005
Sold by
Chournos Lanse
Bought by
Discovery Development Llc
Home Financials for this Owner
Home Financials are based on the most recent Mortgage that was taken out on this home.
Original Mortgage
$200,800
Interest Rate
5.9%
Mortgage Type
Purchase Money Mortgage
Create a Home Valuation Report for This Property
The Home Valuation Report is an in-depth analysis detailing your home's value as well as a comparison with similar homes in the area
Home Values in the Area
Average Home Value in this Area
Purchase History
| Date | Buyer | Sale Price | Title Company |
|---|---|---|---|
| Sakahara Timothy Michael | -- | Old Republic National Title | |
| Yarbrough Sam | -- | United Title Services | |
| Antonio San | -- | United Title Services | |
| Foot Lindsay J | -- | Bonneville Superior Title Co | |
| Destination Homes Inc | -- | Bonneville Title Company | |
| Destination Homes Inc | -- | Security Title | |
| Discovery Development Llc | -- | Founders Title Co |
Source: Public Records
Mortgage History
| Date | Status | Borrower | Loan Amount |
|---|---|---|---|
| Open | Sakahara Timothy Michael | $490,000 | |
| Previous Owner | Yarbrough Sam | $210,400 | |
| Previous Owner | Antonio San | $210,400 | |
| Previous Owner | Foot Lindsay J | $209,170 | |
| Previous Owner | Destination Homes Inc | $200,800 | |
| Previous Owner | Destination Homes Inc | $2,227,500 |
Source: Public Records
Tax History Compared to Growth
Tax History
| Year | Tax Paid | Tax Assessment Tax Assessment Total Assessment is a certain percentage of the fair market value that is determined by local assessors to be the total taxable value of land and additions on the property. | Land | Improvement |
|---|---|---|---|---|
| 2025 | $3,426 | $330,550 | $117,521 | $213,029 |
| 2024 | $3,222 | $312,950 | $96,072 | $216,878 |
| 2023 | $3,045 | $539,000 | $133,929 | $405,071 |
| 2022 | $3,191 | $309,650 | $77,249 | $232,401 |
| 2021 | $2,929 | $440,000 | $114,029 | $325,971 |
| 2020 | $2,634 | $383,000 | $99,897 | $283,103 |
| 2019 | $2,494 | $358,000 | $96,954 | $261,046 |
| 2018 | $2,323 | $331,000 | $94,007 | $236,993 |
| 2016 | $2,096 | $156,641 | $36,108 | $120,533 |
| 2015 | $2,206 | $157,026 | $36,108 | $120,918 |
| 2014 | $2,071 | $150,229 | $36,108 | $114,121 |
| 2013 | -- | $141,133 | $36,655 | $104,478 |
Source: Public Records
Map
Nearby Homes