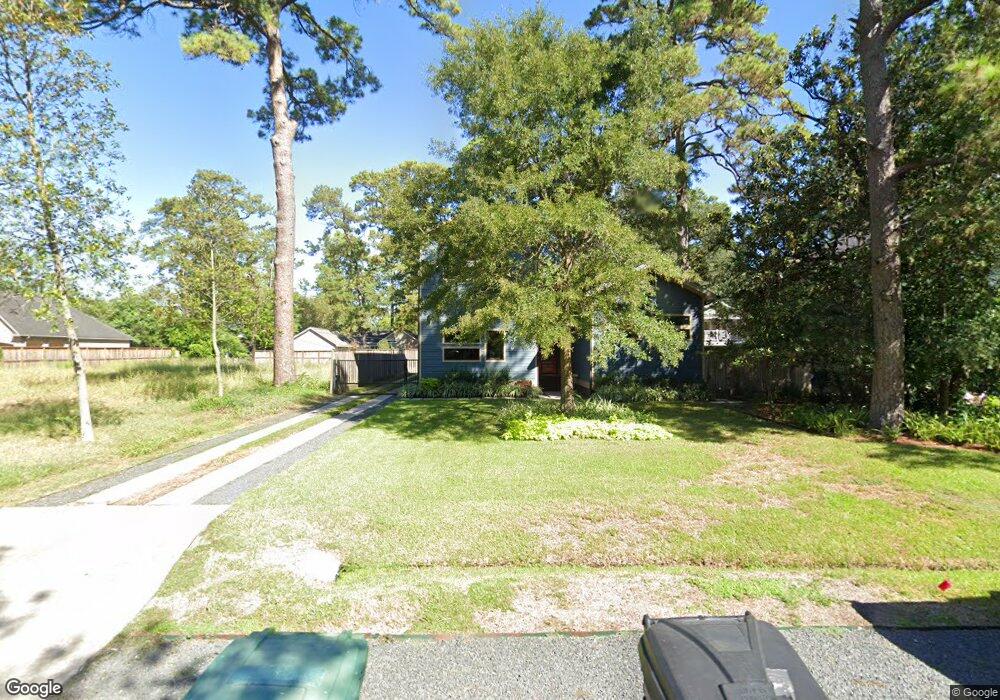
516 W 33rd St Houston, TX 77018
Oak Forest-Garden Oaks NeighborhoodEstimated Value: $1,127,000 - $1,663,000
4
Beds
6
Baths
3,452
Sq Ft
$395/Sq Ft
Est. Value
About This Home
This home is located at 516 W 33rd St, Houston, TX 77018 and is currently estimated at $1,364,098, approximately $395 per square foot. 516 W 33rd St is a home located in Harris County with nearby schools including Garden Oaks Montessori, Frank Black Middle School, and Booker T Washington Sr High.
Ownership History
Date
Name
Owned For
Owner Type
Purchase Details
Closed on
Aug 13, 2014
Sold by
Mikulenka Johnny I and Mikulenka Lydia
Bought by
Watt Susannah and Watt Christopher
Current Estimated Value
Home Financials for this Owner
Home Financials are based on the most recent Mortgage that was taken out on this home.
Original Mortgage
$308,000
Outstanding Balance
$235,287
Interest Rate
4.16%
Mortgage Type
New Conventional
Estimated Equity
$1,128,811
Purchase Details
Closed on
Jan 16, 2012
Sold by
Allen Joan C
Bought by
Lightfoot Lance A and Lightfoot Jessica M
Home Financials for this Owner
Home Financials are based on the most recent Mortgage that was taken out on this home.
Original Mortgage
$605,600
Interest Rate
4.37%
Mortgage Type
Construction
Create a Home Valuation Report for This Property
The Home Valuation Report is an in-depth analysis detailing your home's value as well as a comparison with similar homes in the area
Home Values in the Area
Average Home Value in this Area
Purchase History
| Date | Buyer | Sale Price | Title Company |
|---|---|---|---|
| Watt Susannah | -- | First American Title | |
| Watt Susannah | -- | First American Title | |
| Lightfoot Lance A | -- | Veritas Title |
Source: Public Records
Mortgage History
| Date | Status | Borrower | Loan Amount |
|---|---|---|---|
| Open | Watt Susannah | $308,000 | |
| Closed | Watt Susannah | $308,000 | |
| Previous Owner | Lightfoot Lance A | $605,600 |
Source: Public Records
Tax History Compared to Growth
Tax History
| Year | Tax Paid | Tax Assessment Tax Assessment Total Assessment is a certain percentage of the fair market value that is determined by local assessors to be the total taxable value of land and additions on the property. | Land | Improvement |
|---|---|---|---|---|
| 2025 | $18,082 | $1,279,880 | $540,918 | $738,962 |
| 2024 | $18,082 | $1,197,235 | $540,918 | $656,317 |
| 2023 | $18,082 | $1,107,688 | $515,160 | $592,528 |
| 2022 | $20,566 | $934,003 | $425,007 | $508,996 |
| 2021 | $21,326 | $915,000 | $399,249 | $515,751 |
| 2020 | $21,624 | $892,963 | $399,249 | $493,714 |
| 2019 | $22,658 | $1,030,662 | $399,249 | $631,413 |
| 2018 | $16,258 | $898,284 | $360,612 | $537,672 |
| 2017 | $18,711 | $740,000 | $360,612 | $379,388 |
| 2016 | $19,976 | $790,000 | $360,612 | $429,388 |
| 2015 | $14,423 | $730,000 | $360,612 | $369,388 |
| 2014 | $14,423 | $707,925 | $257,580 | $450,345 |
Source: Public Records
Map
Nearby Homes
- 824 & 828 W 32nd St
- 524 W 34th St
- 519 W 31st St
- 520 W 30th St
- 336 W 32nd St
- 431 W 30th St
- 408 W 30th St
- 312 W 32nd St
- 717 Sue Barnett Dr
- 710 Sue Barnett Dr
- 544 W 28th St
- 509 W 27th St
- 531 W 27th St
- 2710 Nicholson St
- 3902 Zina Way
- 822 W 31st St
- 2708 N Shepherd Dr
- 326 W 28th St
- 207 W 33rd St
- 3903 Yale Heights Dr