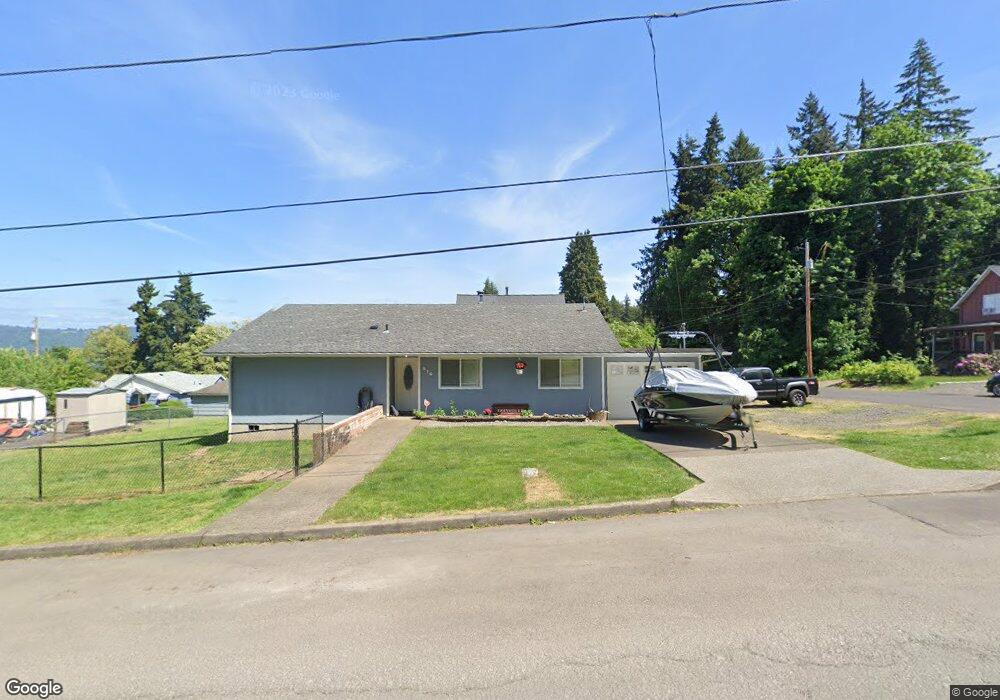
516 W 4th St Rainier, OR 97048
Estimated Value: $342,553 - $423,000
3
Beds
2
Baths
1,402
Sq Ft
$260/Sq Ft
Est. Value
About This Home
This home is located at 516 W 4th St, Rainier, OR 97048 and is currently estimated at $364,638, approximately $260 per square foot. 516 W 4th St is a home located in Columbia County with nearby schools including Hudson Park Elementary School, Rainier Junior/Senior High School, and North Columbia Academy.
Ownership History
Date
Name
Owned For
Owner Type
Purchase Details
Closed on
Jul 13, 2007
Sold by
Hsbc Bank Usa Na
Bought by
Chapman Don E and Howard Lisa A
Current Estimated Value
Home Financials for this Owner
Home Financials are based on the most recent Mortgage that was taken out on this home.
Original Mortgage
$160,100
Outstanding Balance
$130,614
Interest Rate
6.51%
Mortgage Type
Unknown
Estimated Equity
$234,024
Purchase Details
Closed on
Jul 28, 2005
Sold by
Ott Hans W and Ott June M
Bought by
Morgan Gayle
Home Financials for this Owner
Home Financials are based on the most recent Mortgage that was taken out on this home.
Original Mortgage
$103,600
Interest Rate
6.87%
Mortgage Type
Fannie Mae Freddie Mac
Create a Home Valuation Report for This Property
The Home Valuation Report is an in-depth analysis detailing your home's value as well as a comparison with similar homes in the area
Home Values in the Area
Average Home Value in this Area
Purchase History
| Date | Buyer | Sale Price | Title Company |
|---|---|---|---|
| Chapman Don E | $160,100 | Multiple | |
| Morgan Gayle | $129,500 | Ticor Title |
Source: Public Records
Mortgage History
| Date | Status | Borrower | Loan Amount |
|---|---|---|---|
| Open | Chapman Don E | $160,100 | |
| Previous Owner | Morgan Gayle | $103,600 |
Source: Public Records
Tax History Compared to Growth
Tax History
| Year | Tax Paid | Tax Assessment Tax Assessment Total Assessment is a certain percentage of the fair market value that is determined by local assessors to be the total taxable value of land and additions on the property. | Land | Improvement |
|---|---|---|---|---|
| 2025 | $3,130 | $169,470 | $43,900 | $125,570 |
| 2024 | $3,057 | $164,540 | $42,620 | $121,920 |
| 2023 | $3,015 | $159,750 | $39,120 | $120,630 |
| 2022 | $2,879 | $155,100 | $37,980 | $117,120 |
| 2021 | $2,832 | $150,590 | $41,850 | $108,740 |
| 2020 | $2,752 | $146,210 | $39,330 | $106,880 |
| 2019 | $2,709 | $141,960 | $38,170 | $103,790 |
| 2018 | $2,646 | $137,830 | $56,910 | $80,920 |
| 2017 | $2,497 | $133,820 | $55,260 | $78,560 |
| 2016 | $2,293 | $129,930 | $53,650 | $76,280 |
| 2015 | $1,916 | $109,220 | $35,410 | $73,810 |
| 2014 | $1,945 | $111,050 | $35,450 | $75,600 |
Source: Public Records
Map
Nearby Homes