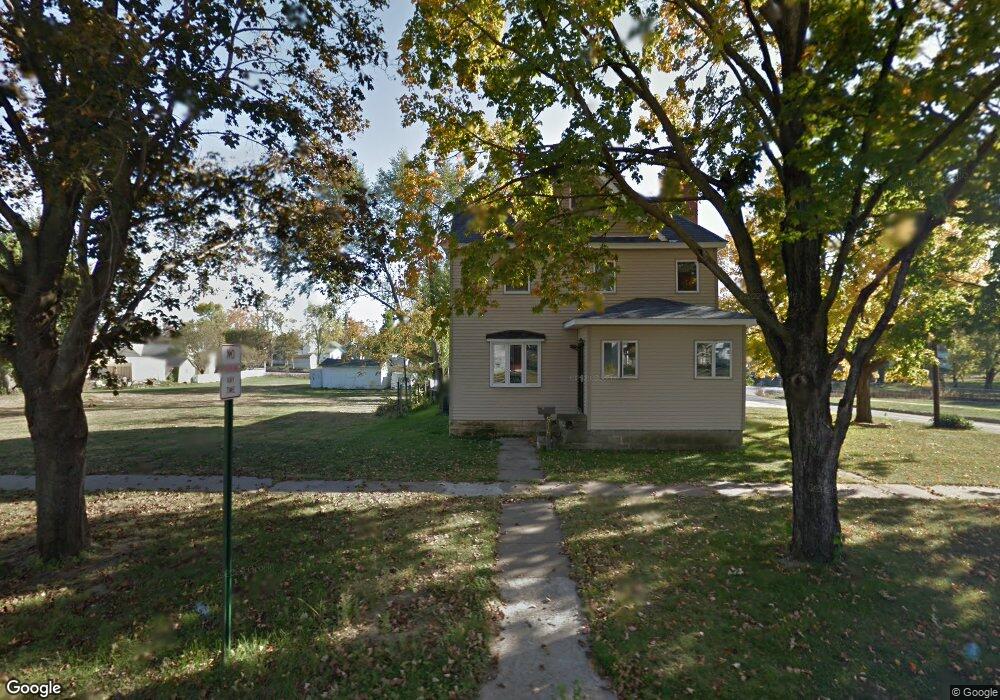
516 W 6th St Vinton, IA 52349
Estimated Value: $202,562 - $229,000
3
Beds
3
Baths
2,185
Sq Ft
$97/Sq Ft
Est. Value
About This Home
This home is located at 516 W 6th St, Vinton, IA 52349 and is currently estimated at $212,641, approximately $97 per square foot. 516 W 6th St is a home located in Benton County with nearby schools including Tilford Elementary School, Vinton-Shellsburg Middle School, and Vinton-Shellsburg High School.
Ownership History
Date
Name
Owned For
Owner Type
Purchase Details
Closed on
Mar 2, 2007
Sold by
Gmac Mortgage Llc
Bought by
Phelps Ronald P and Phelps Mia K
Current Estimated Value
Home Financials for this Owner
Home Financials are based on the most recent Mortgage that was taken out on this home.
Original Mortgage
$75,000
Outstanding Balance
$46,182
Interest Rate
6.67%
Mortgage Type
Adjustable Rate Mortgage/ARM
Estimated Equity
$166,459
Create a Home Valuation Report for This Property
The Home Valuation Report is an in-depth analysis detailing your home's value as well as a comparison with similar homes in the area
Home Values in the Area
Average Home Value in this Area
Purchase History
| Date | Buyer | Sale Price | Title Company |
|---|---|---|---|
| Phelps Ronald P | $40,000 | None Available |
Source: Public Records
Mortgage History
| Date | Status | Borrower | Loan Amount |
|---|---|---|---|
| Open | Phelps Ronald P | $75,000 |
Source: Public Records
Tax History
| Year | Tax Paid | Tax Assessment Tax Assessment Total Assessment is a certain percentage of the fair market value that is determined by local assessors to be the total taxable value of land and additions on the property. | Land | Improvement |
|---|---|---|---|---|
| 2025 | $3,030 | $190,500 | $16,600 | $173,900 |
| 2024 | $3,030 | $171,900 | $15,900 | $156,000 |
| 2023 | $2,800 | $171,900 | $15,900 | $156,000 |
| 2022 | $2,872 | $139,000 | $12,700 | $126,300 |
| 2021 | $2,872 | $139,000 | $12,700 | $126,300 |
| 2020 | $2,930 | $144,200 | $14,100 | $130,100 |
| 2019 | $2,856 | $144,200 | $14,100 | $130,100 |
| 2018 | $2,770 | $138,800 | $13,600 | $125,200 |
| 2017 | $2,658 | $138,800 | $13,600 | $125,200 |
| 2016 | $2,610 | $129,700 | $12,700 | $117,000 |
| 2015 | $2,610 | $129,700 | $12,700 | $117,000 |
| 2014 | $2,416 | $120,400 | $0 | $0 |
Source: Public Records
Map
Nearby Homes
- 503 D Ave
- 209 W 5th St
- 511 1st Ave
- 1002 J Ave
- 1006 J Ave
- 507 W 13th St
- 212 E 9th St
- 1001 W 13th St
- 302 E 9th St
- 1005 W 13th St
- 1009 W 13th St
- 206 E 13th St
- 0 Lot 32 Mary Ingalls Subdivision Unit 2602214
- 516 E 4th St
- 501 E 11th St
- 805 W 17th St
- 614 E 4th St
- 304 Viking Dr
- 107 Blue Jay Ave
- 601 E 11th St
Your Personal Tour Guide
Ask me questions while you tour the home.