Estimated Value: $239,459 - $316,000
--
Bed
3
Baths
2,224
Sq Ft
$130/Sq Ft
Est. Value
About This Home
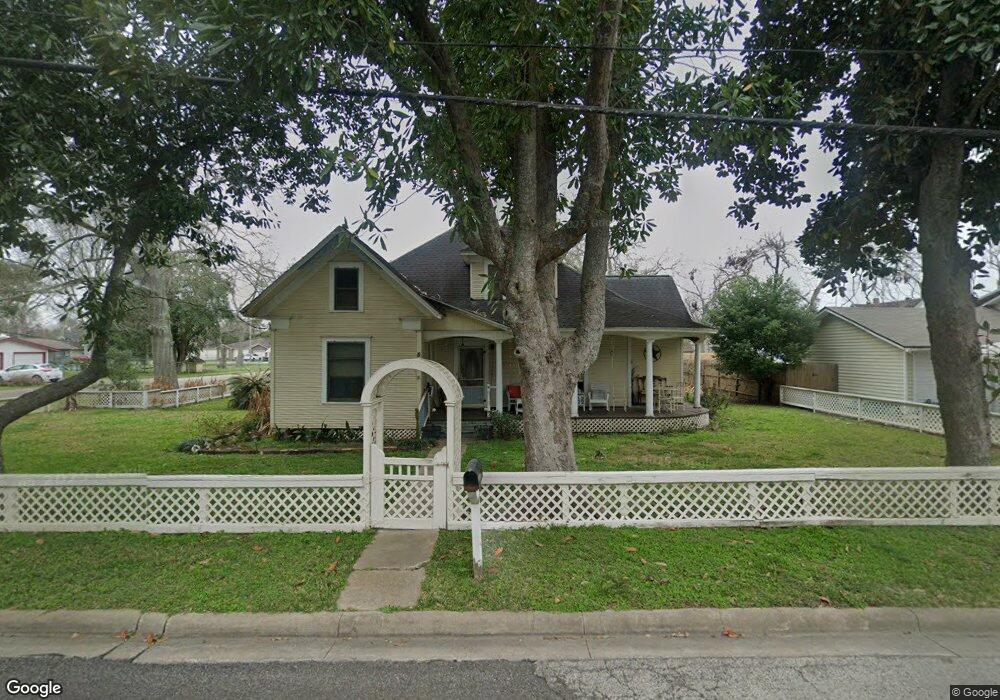
This home is located at 516 W Sealy St, Alvin, TX 77511 and is currently estimated at $288,115, approximately $129 per square foot. 516 W Sealy St is a home located in Brazoria County with nearby schools including Alvin Elementary School, Fairview Junior High School, and Alvin High School.
Ownership History
Date
Name
Owned For
Owner Type
Purchase Details
Closed on
Feb 7, 2005
Sold by
Johnson Betty Jean
Bought by
Overstreet Kenneth G
Current Estimated Value
Home Financials for this Owner
Home Financials are based on the most recent Mortgage that was taken out on this home.
Original Mortgage
$145,000
Outstanding Balance
$74,186
Interest Rate
5.85%
Mortgage Type
Seller Take Back
Estimated Equity
$213,929
Purchase Details
Closed on
Apr 9, 1997
Sold by
Sailer Charles R and Sailer Betty A
Bought by
Johnson Betty Jean
Home Financials for this Owner
Home Financials are based on the most recent Mortgage that was taken out on this home.
Original Mortgage
$86,400
Interest Rate
7.82%
Purchase Details
Closed on
Feb 22, 1996
Sold by
Crainer Allen B
Bought by
Sailer Charles R and Sailer Betty A
Purchase Details
Closed on
Nov 6, 1995
Sold by
Crainer Allen B
Bought by
Sailer Charles R and Sailer Betty A
Create a Home Valuation Report for This Property
The Home Valuation Report is an in-depth analysis detailing your home's value as well as a comparison with similar homes in the area
Home Values in the Area
Average Home Value in this Area
Purchase History
| Date | Buyer | Sale Price | Title Company |
|---|---|---|---|
| Overstreet Kenneth G | -- | -- | |
| Johnson Betty Jean | -- | -- | |
| Sailer Charles R | -- | -- | |
| Sailer Charles R | -- | -- |
Source: Public Records
Mortgage History
| Date | Status | Borrower | Loan Amount |
|---|---|---|---|
| Open | Overstreet Kenneth G | $145,000 | |
| Previous Owner | Johnson Betty Jean | $86,400 |
Source: Public Records
Tax History Compared to Growth
Tax History
| Year | Tax Paid | Tax Assessment Tax Assessment Total Assessment is a certain percentage of the fair market value that is determined by local assessors to be the total taxable value of land and additions on the property. | Land | Improvement |
|---|---|---|---|---|
| 2025 | $1,818 | $281,281 | $37,500 | $251,250 |
| 2023 | $1,818 | $232,464 | $30,000 | $254,240 |
| 2022 | $5,797 | $211,331 | $30,000 | $220,730 |
| 2021 | $5,547 | $215,670 | $31,500 | $184,170 |
| 2020 | $5,112 | $190,660 | $27,000 | $163,660 |
| 2019 | $4,769 | $182,320 | $22,500 | $159,820 |
| 2018 | $4,343 | $151,590 | $22,500 | $129,090 |
| 2017 | $3,998 | $131,220 | $22,500 | $108,720 |
| 2016 | $3,828 | $131,220 | $22,500 | $108,720 |
| 2015 | $1,515 | $114,210 | $18,750 | $95,460 |
| 2014 | $1,515 | $107,270 | $18,750 | $88,520 |
Source: Public Records
Map
Nearby Homes
- 711 W Sidnor St
- 412 W Sidnor St
- 4602 Cottonwood Run
- 303 S Jackson St
- 417 W Blum St
- 2710 Hackberry Run
- 403 S Hill St Unit L
- 1009 W Snyder St
- 816 W Adoue St
- 918 W Lang St
- 1023 W Snyder St
- 0 W Sealy St
- 1001 W Lobitt St
- 218 W Blum St
- 0 W Lobbit St Unit 88257207
- 405 W Lang St
- 2195 W Lang St
- 710 S Jackson St
- 1314 W Willis St
- 1316 W Willis St